
The first sign of a good trend is often a quiet rise, not a loud boom. That’s why I use exploding topics trends as an early map, not a verdict. A chart can look exciting and still lead nowhere.
I watch for the shape behind the line, then I test whether people care enough to act. If the demand feels real, I keep digging. If it only feels loud, I move on.
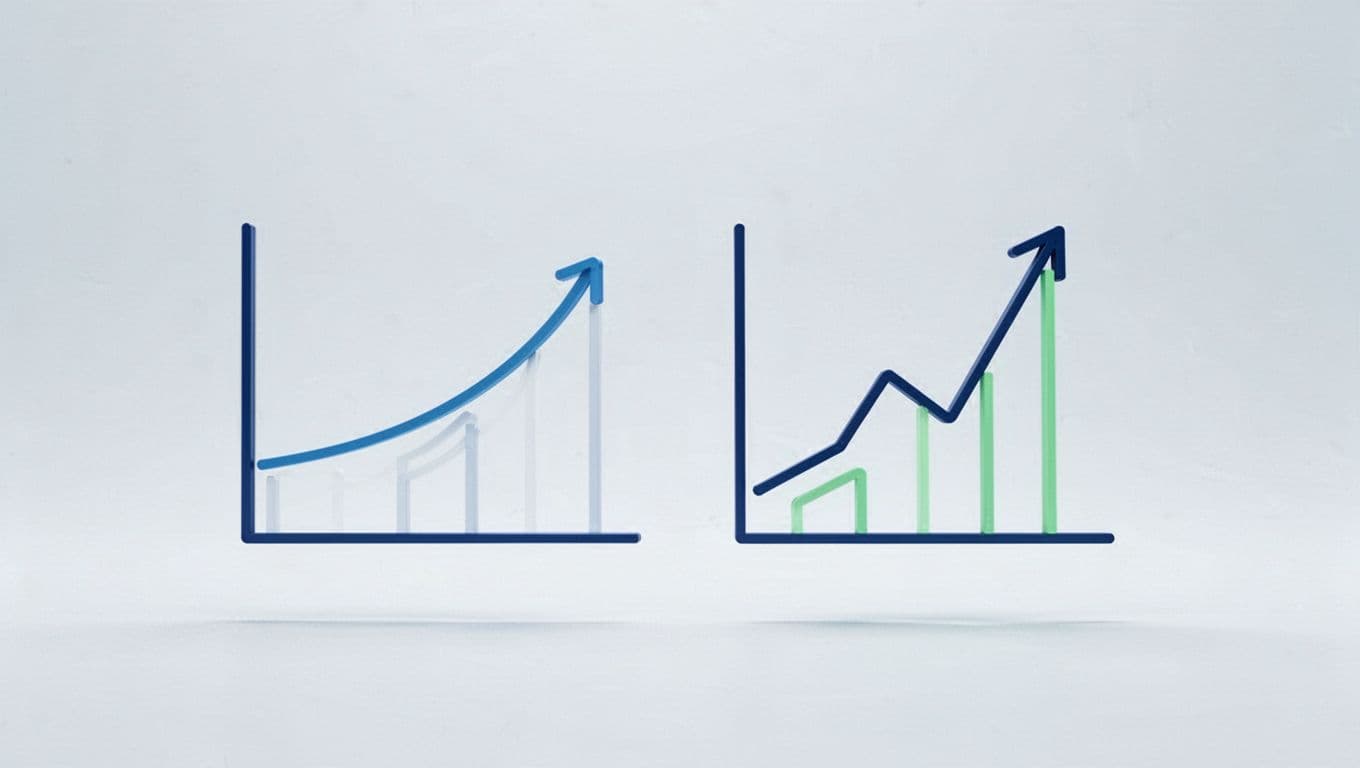
I read the growth curve like a pulse
When I open Exploding Topics, I do not chase the biggest number first. I look for a smooth climb, repeated bumps, and a story that holds up over time. A one-week spike can be noise, but a steady rise over months can point to real demand.
A spike is a rumor. A slope is evidence.
Right now, I’m seeing topics like AI for teachers, AI video generators, Japanese head spa, magnesium glycinate, and heated blanket hoodies. I don’t treat them the same. Some are novelty-heavy, while others point to a deeper change in habits, health, or comfort.
When I want a broader primer, I compare my notes with Exploding Topics’ guide to finding trends early. I also keep my own notes beside using Exploding Topics for early trend discovery, because pattern reading gets sharper when I see the same idea from two angles.

I compare topics inside the same category
A single trend can fool me. A cluster is harder to ignore. So I ask whether a topic belongs to a real category or sits alone like a one-hit song.
For example, AI image enhancer, AI video generator, and AI voice detector sit in the same creator-tool family. That tells me more than one term ever could. In another lane, smart humidifier, heated blanket hoodie, and countertop mat all point to comfort-led product demand.
I also check whether the category has room to grow. If a topic fits a broader use case, I pay more attention. If it feels narrow and isolated, I slow down. That helps me separate a flash from a market.
I like this habit because it lines up with how Exploding Topics spots trends early. It also keeps me from mistaking one hot keyword for a whole business.
When a cluster keeps widening, I compare it with fast growing industries in 2026 with Exploding Topics. That gives me a better sense of whether I’m seeing a topic, a category, or a market shift.
I validate demand before I trust the trend
After I like a trend, I try to break it. That sounds harsh, but it saves me from bad bets. I want proof that real people care.
Here’s the quick filter I use:
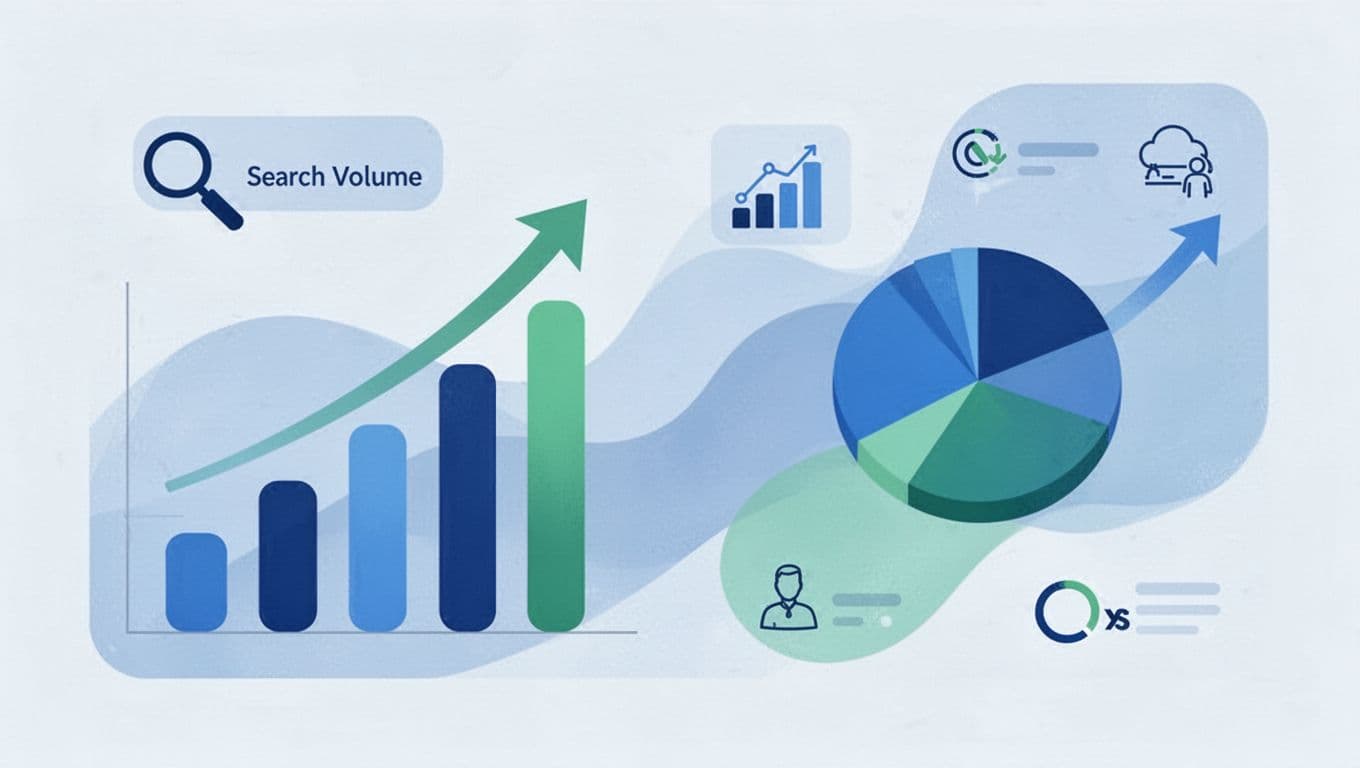
- I check Google Trends for shape, not just volume. A slow rise matters more than a loud spike.
- I read Reddit threads, YouTube comments, and niche forums. I look for pain words, time loss, and money talk.
- I search for buyer language. Words like pricing, tool, service, kit, and best tell me intent is getting close.
- I scan the competition. Crowded does not always mean dead, but weak offers can leave room for me.
If I want a content angle, I pair this with low competition keywords via Exploding Topics, because a rising topic still needs a clear path into search.
I also cross-check my read with How to Spot Trends Before They Happen. That helps me stay honest when the charts look tempting but the outside signal feels thin.
I separate fads from durable markets
This is where many trend hunters get burned. A fad burns bright, then fades fast. A durable trend keeps finding new buyers, new uses, and new budget.
The split usually looks like this:
| Signal | Short-lived fad | Durable trend |
|---|---|---|
| Main driver | Hype, meme, or seasonal buzz | Repeated pain, habit, or budget |
| Search pattern | Sharp spike, quick drop | Slow climb, then wider lift |
| Buyer intent | Curiosity and clicks | Pricing, tools, services, solutions |
| Business fit | One-off sale, thin margins | Repeat use, support, upgrades |
I read that table with one question in mind, can this keep going after the first burst? If the answer is yes, I keep going. If the answer is no, I save my time.
When a trend looks wide enough to become a market, I compare it with fast growing industries in 2026 with Exploding Topics. That helps me judge whether the signal belongs in a larger shift.
For marketers, I use this method to find content clusters and landing page angles. For founders, I look for a narrow problem worth solving. For investors, I check whether budget and repeat use sit behind the buzz. For content creators, I look for questions people are already asking, but not enough writers are answering.
I care about what the trend can become
A trend is only useful if I know what to do with it. I ask whether it can support a product, a service, a newsletter, or a content series. If it can, I keep it on my list. If it cannot, I let it pass.
That’s the real value of Exploding Topics. It helps me notice movement early, then decide whether that movement has weight. The chart opens the door, but the validation does the real work.
A rising line is only the start. The win comes from seeing what’s behind it before everyone else does.