
A SaaS dashboard can turn into a junk drawer fast. When I build a Baremetrics dashboard, I want one screen that tells me, in under a minute, if revenue is stronger, weaker, or quietly leaking.
That matters because founders, operators, and finance teams don’t need more charts. We need signals we can trust, plus enough context to act. I start with the frame, then I give each widget one job.
Build the frame before you pick metrics
As of March 2026, Baremetrics’ public dashboard examples and templates show custom views, filters, comparisons, and shared layouts. That flexibility helps, but it also tempts me to add too much.
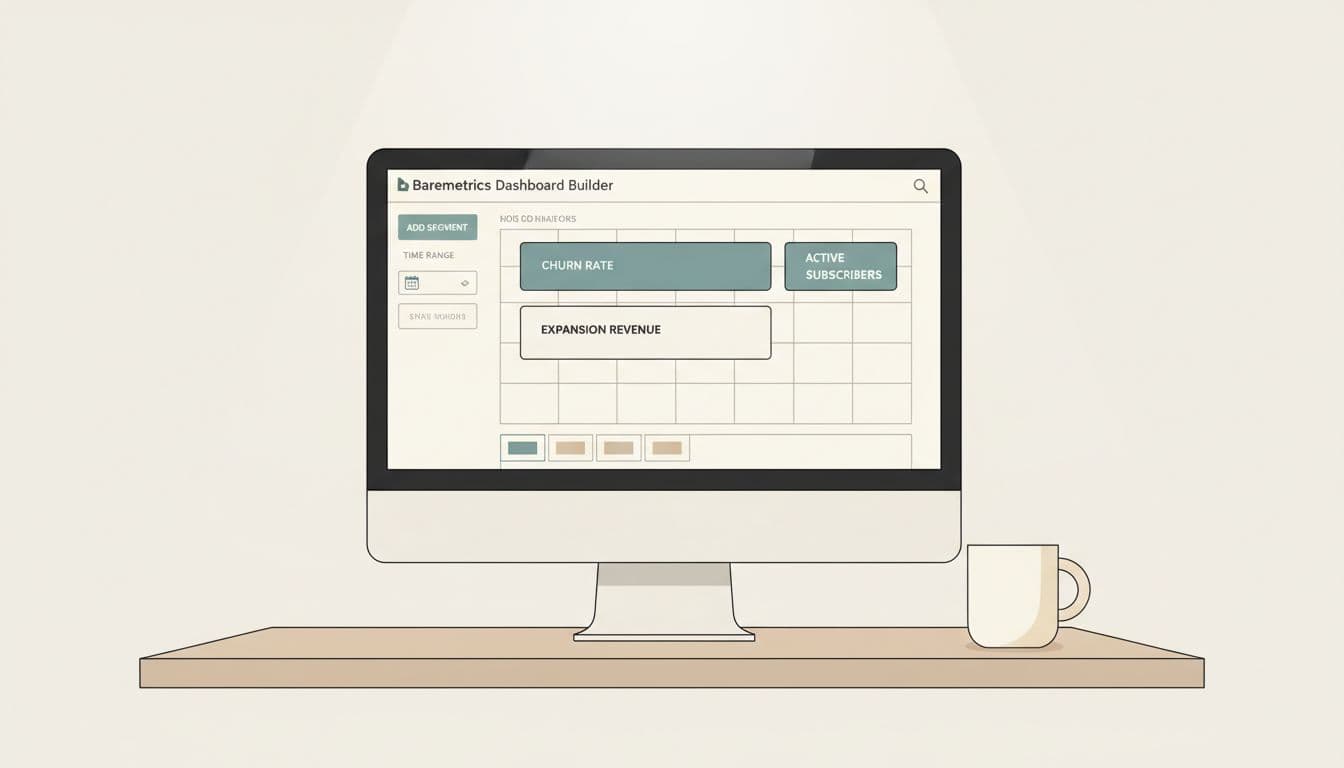
I keep the main Baremetrics dashboard to eight widgets or fewer. I start from a blank page and add three widget types in order, metric cards, trend charts, and one cohort view. That order keeps me from decorating before I know what story the page should tell.
The first row gets headline numbers, MRR, ARR, churn, and expansion revenue. The second row gets movement, usually MRR trend, ARPU, and retention. A third row, if I need it, can hold LTV, CAC, and a note tied to a launch, pricing change, or sales push.
Time range matters as much as the widget. I set the default view to the last 12 months because board-level talks need shape, not noise. Then I switch to 30 or 90 days when I want to inspect a pricing test, a new onboarding flow, or a drop in renewals. If seasonality matters, I compare the same period last year.
Segmentation is where the dashboard starts to breathe. I usually slice by plan, country, and contract type first. If CRM or imported data is connected, I also look at acquisition source or sales-assisted versus self-serve.
I also split my views. The executive page stays clean. A second operating dashboard can hold live activity, failed payments, and deeper tables. That keeps the main screen calm enough to read in a weekly meeting.
Put the right numbers on the dashboard
Every metric needs a place and a purpose. If a number can’t change a decision, I don’t pin it to the front page of the business.
If a widget needs a long explanation, it doesn’t belong on the executive dashboard.
MRR is my heartbeat. It shows the monthly recurring revenue I can count on, so I place it as a large card with a small trend line. ARR is the yearly view of that same engine, and I keep it beside MRR because finance teams and investors often think in annual terms. When I want a quick cross-check, I compare my layout to Baremetrics’ SaaS metrics checklist.
Churn needs more care. Customer churn tells me how many accounts I lose. Revenue churn tells me how much recurring revenue disappears. I track both because one large account can hide inside a calm-looking customer churn rate. Expansion revenue belongs next to churn, not far away, because upgrades and add-ons soften the hit. When I need a deeper read on the math, I use calculating customer and revenue churn in Baremetrics.

LTV tells me how much a customer is worth over the life of the relationship. CAC tells me what I paid to win that customer. I want those two side by side because a healthy SaaS business can’t judge one without the other. ARPU, meanwhile, tells me the average revenue per account or user. I prefer it as a trend chart, split by plan, because a rising ARPU can hide discounts or a shift toward smaller accounts if I only watch the top line.
Cohort retention is where the story stops being flat. A retention curve or cohort table shows whether newer customers stick longer than older ones. That view helps me spot if a product fix improved month-three retention, or if a new plan pulls in users who leave fast. For ARR planning, I also like this guide to net new ARR math, because expansion, contraction, and churn need to connect back to the growth story.
Use segments and time windows to turn metrics into action
A dashboard is only useful if it changes what I do on Monday. So I build a review rhythm around it.
First, I read the 30-day view for fresh signals. Next, I zoom out to 12 months so I don’t overreact to one noisy week. If MRR slows while ARPU rises, I may be moving upmarket. If ARPU drops while new signups jump, I check discounts, lower-priced plans, or weaker fit. When churn rises in one segment, I inspect cancellation reasons, plan mix, and failed payments before I blame the product.
Baremetrics gives me useful ways to keep the dashboard alive, not static. I segment by plan tier or region, compare date ranges to spot before-and-after changes, and add comments when pricing or onboarding shifts. Scheduled email or Slack reports help the team keep the same score. If the issue is involuntary churn, Baremetrics’ guide to reducing SaaS churn is a smart next read, and Recover can help separate failed-card problems from true customer loss.
The biggest mistake I see is mixing audiences. Finance wants clean revenue logic. Customer success wants retention signals. Founders want the shortest path from numbers to action. I solve that by keeping one executive dashboard and one deeper operating view, then I review both every week.
A strong dashboard is less like a mural and more like a windshield. When I keep it focused on MRR, churn, expansion, LTV, CAC, ARPU, and retention, I can see trouble early and growth more honestly.
Build the first version, watch it for two weeks, then cut anything nobody uses.
Open a blank dashboard and place the six numbers that would change your next decision. That’s the version worth sharing.