If I don’t check my podcast numbers often, I miss the story hiding in them. A strong launch can fade fast, while a slow start can keep growing for weeks.
That’s why I use Transistor listener stats as a weekly habit, not a vanity check. The dashboard tells me which episodes pull, which apps people use, and where listeners live, but I still read the numbers with care.
Start with the analytics page that gives me the clearest read
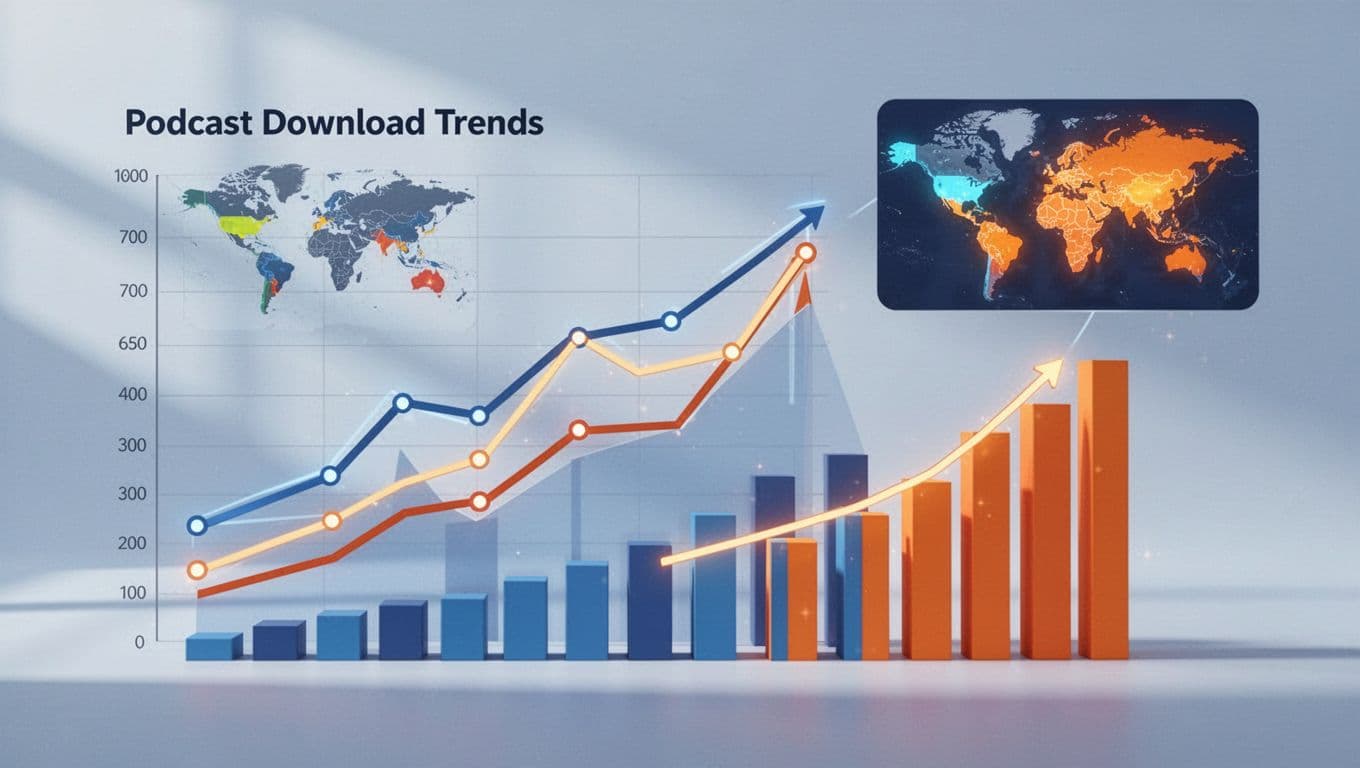
When I open the Transistor.fm podcast analytics software, I look for three things first: monthly listens, average downloads per episode, and the trend line over time. Those three views tell me whether my show is rising, flat, or slipping.
I also pay attention to the average downloads in the first 7, 30, 60, and 90 days. A strong 7-day number means the episode had a solid launch. A stronger 30-day number means the topic has staying power.

Transistor also shows estimated subscribers, which I treat as a rough audience signal. It’s based on the first 24 hours of the last three episodes, so I never treat it like a perfect headcount. Still, it helps me see direction.
The public podcast stats guide is useful here too, because it explains the same core metrics in plain language. I like that approach, since podcast stats can get fuzzy fast.
A useful pattern usually looks like this: the 7-day chart climbs, the 30-day chart keeps moving, and the subscriber estimate holds steady or rises. A weak pattern looks different. The launch may spike, then stall hard.
Read episode, app, and location data together
I get better decisions when I compare metrics instead of staring at one chart. Transistor makes that easier because I can compare episode downloads, app usage, and listener locations in the same dashboard.
Here’s the quick way I think about each metric:
| Metric | What it tells me | How I use it |
|---|---|---|
| Average downloads in 7/30/60/90 days | Early pull and long-tail value | Decide whether to reuse the topic |
| Estimated subscribers | Rough size of the steady audience | Track growth without pretending it’s exact |
| Listening apps | Where people press play | Tailor promo and app-specific notes |
| Listener locations | Where the audience clusters | Time posts and plan local examples |
The pattern matters more than any single number. If Apple Podcasts leads and Spotify stays steady, I know where a chunk of my audience already listens. If one country or state starts rising, I look for a guest, topic, or promo channel that may have caused it.
I treat downloads as strong evidence of interest, but not proof of a full listen. That keeps my reports honest.
When I need a side-by-side view, I use Transistor’s compare podcast episode downloads view. That makes it easier to spot whether a new episode beat the last one because of the title, the guest, or the topic.
If I want to dig deeper into app behavior, I cross-check with the Spotify for Creators dashboard. That’s helpful because platform-specific stats can add context, even when Transistor already gives me the broad picture.
Turn the numbers into better publishing decisions
Stats only matter when they change what I do next. If an episode gets a fast 7-day spike, I usually treat it as a candidate for repurposing, email promotion, or a follow-up topic. If the 30-day curve keeps climbing, I know the subject has evergreen value.
I also watch for bad signs. A strong launch followed by a flat line often means the title carried the episode, but the topic didn’t stick. In that case, I test a different angle next time.
When a topic starts to work, I often move it into my Transistor.fm Opus Clip workflow. That helps me turn one good episode into short clips, social posts, and follow-up content without guessing what to cut.
A simple decision loop helps me stay consistent:
- If the first 24 hours are strong, I promote the episode again in clips and email.
- If the 30-day curve is stronger than the launch, I revisit the topic in a future episode.
- If listener locations shift after a guest share, I repeat that channel next time.
I also pay attention to timing. If most listeners come from one region, I schedule posts when that audience is awake. If a topic pulls a new app audience, I sharpen the show notes and intro for that listener type.
For creators who repurpose audio often, I’ve found that pairing stats with a clip workflow makes the numbers more useful. I’m not chasing charts. I’m looking for signals I can act on.

The smartest way I use Transistor stats
When I check Transistor every week, I’m not chasing a score. I’m reading behavior. Downloads tell me what got attention, apps show where listeners are, and location data points to real pockets of interest.
That mix is enough to guide my next episode, my next promo push, and my next round of clips. The best part is that I don’t need perfect data to make better choices, I just need to read the pattern clearly.