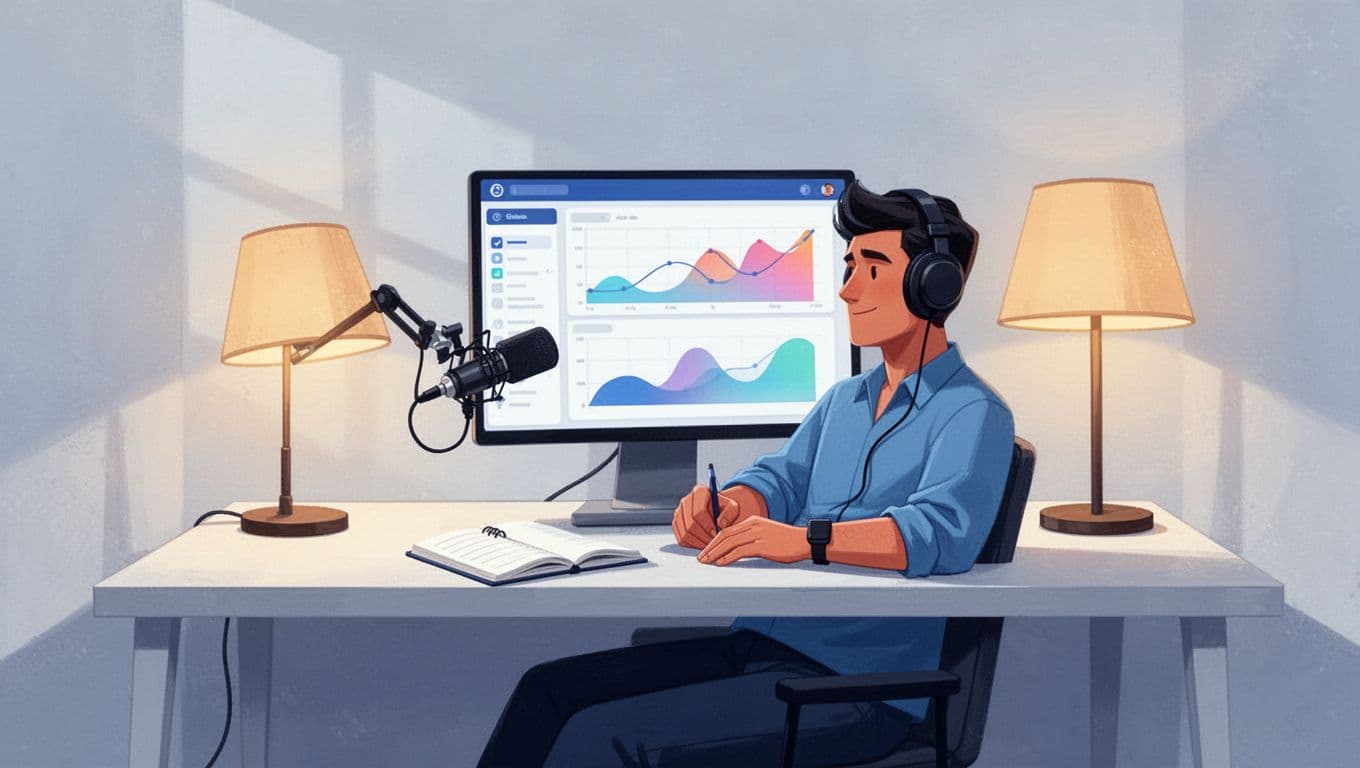
You know that sinking feeling when podcast downloads spike, but you’re buried in spreadsheets chasing numbers? I wasted hours each week pulling listener stats manually. Spreadsheets from Apple, Spotify, and hosts piled up, and reports for my team took forever.
Transistor.fm changed that for me. It pulls metrics into one dashboard and lets me automate reports. No more copy-paste drudgery. You get clear views of downloads, retention, and growth trends right away.
Let me show you my setup. I’ll walk through the steps I take to track podcast performance without the hassle.
Why I Switched to Automated Podcast Metrics
Manual tracking kills momentum. I used to log into five platforms weekly. Downloads here, plays there, locations scattered. One forgotten stat, and my report looked incomplete.
Transistor.fm centralizes it all. It grabs data from Apple Podcasts, Spotify, and more. I see total listens across apps in seconds. As a result, decisions come faster. Should I promote episode three again? The dashboard answers that.
Automation saves my weekends too. Set once, run forever. Email summaries hit my inbox. My producer gets hers. Clients see polished PDFs. Everyone stays aligned.
Podcasters like us need this. Growth stalls without data. But who has time for grunt work? Transistor handles the heavy lift, so I focus on content.
Setting Up Your Transistor.fm Analytics Dashboard
I start with the basics. Log into Transistor.fm and head to the Analytics tab for any show. It loads episode downloads, listener maps, and player breakdowns instantly.
Filter by date range. Pick 7, 30, or 90 days post-release. Compare episodes side-by-side in their episode comparison table. I spot patterns fast, like why one guest drove twice the plays.
Export data as CSV too. Open in Google Sheets for quick charts. No fancy skills needed.

This view guides my next moves. High-drop episodes get tweaks. Steady growers earn promo slots.
Team access matters. I invite producers with view-only roles. They check stats without touching uploads. Permissions keep things secure.
Setup takes 10 minutes. Link your RSS feed if switching hosts. Data populates in 24-48 hours. From there, automation kicks in.
Key Podcast KPIs I Track and Visualize
Not all numbers matter equally. I focus on five core metrics. Downloads show reach. Retention reveals engagement. Growth tracks momentum.
Here’s what I watch:
- Total downloads: First 7 days predict long-term success.
- Retention curves: Where listeners bail informs edits.
- Geographic data: Target promos by country or state.
- Player sources: Apple dominates? Double down there.
- Episode velocity: New surges signal shares.
Transistor plots these on interactive graphs. I hover for details. For deeper dives, their analytics API pulls daily data into custom tools.
Visuals make decisions obvious. Last month, retention dipped at 15 minutes. I cut fluff and saw plays rise 20%. Data drives that clarity.
Pick your top three KPIs first. Track weekly. Adjust as your show matures.
Building Automated Reports in Transistor.fm
Reports used to eat my Fridays. Now they send themselves. Transistor schedules email summaries. Pick episodes or full shows. Set frequency: daily, weekly, monthly.
I configure mine like this:
- Go to Analytics > Reports.
- Select metrics: downloads, top countries, trends.
- Choose recipients.
- Schedule and save.
Emails arrive formatted. Clients forward them easily. For polish, export CSVs and pipe to Google Data Studio.
Integrations expand this. Connect to Mailchimp or ConvertKit. Push stats to newsletters. I automate listener growth updates for subscribers.
No major new report builders in 2026, but basics work solid. Check their features page for latest tweaks.
Integrations That Power My Workflow
Transistor plays nice with others. I link it to Ghost for private feeds. Subscribers sync automatically. No list scrubbing.
Email tools like ActiveCampaign get stats feeds. Drip runs nurture sequences on high-engagement episodes.
For advanced pulls, the API shines. I query episode data daily. Feed it to Sheets for alerts: “Downloads over 1,000? Notify team.”
In my Transistor.fm workflow for spotting hot segments, analytics guide clip creation. High-retention parts become shorts.
These ties cut manual steps. Data flows where I need it.
Real Decisions From Automated Tracking
Automation shines in action. Episode five lagged. Dashboard showed 40% drop at intro. I shortened it next time. Plays jumped.
Client pitches improved too. Weekly reports prove ROI: “Your promo drove 15% growth.” Numbers close deals.
Scale up confidently. Plan seasons based on trends. Guest who spikes metrics? Book more.
Mistakes to dodge: Ignore outliers. One viral hit skews averages. Use 30-day norms.
Track quarterly. Adjust KPIs as audience shifts.
Conclusion
Transistor.fm turns podcast performance tracking into a background task. I reclaim hours for recording and guests. Dashboards reveal truths. Reports keep teams sharp.
Stick to core KPIs. Automate what you can. Watch growth follow.
Your show deserves this edge. Set it up today. Metrics will guide smarter choices every time.
(Word count: 982)