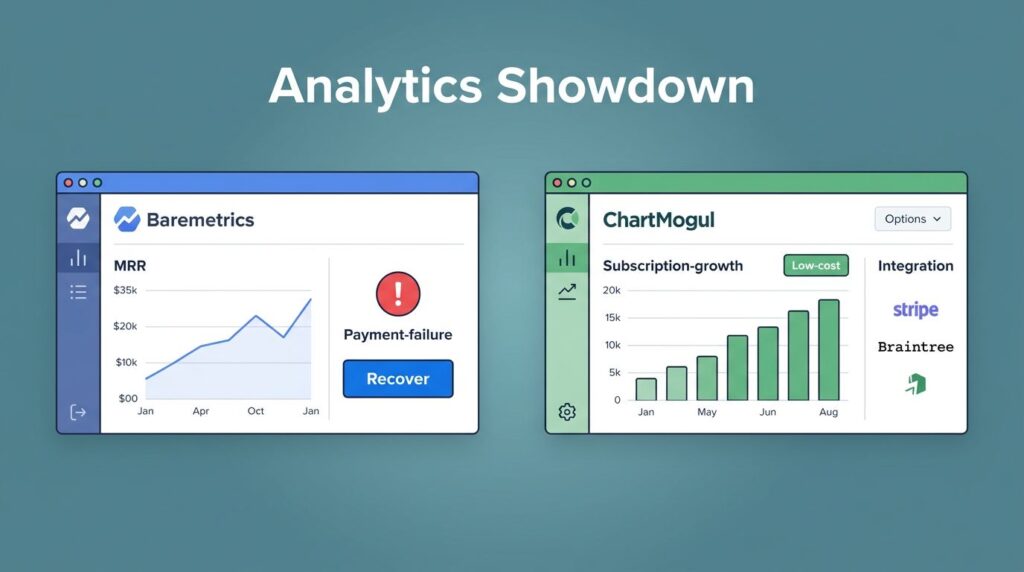
If I only watch customer churn, I can miss a quiet leak in MRR. One large downgrade can hurt more than several small cancellations, and Baremetrics makes that difference hard to ignore.
That is why I treat revenue churn vs customer churn as two separate signals, not one blended problem. Customer churn tells me how many accounts left. Revenue churn tells me how much monthly revenue went with them.
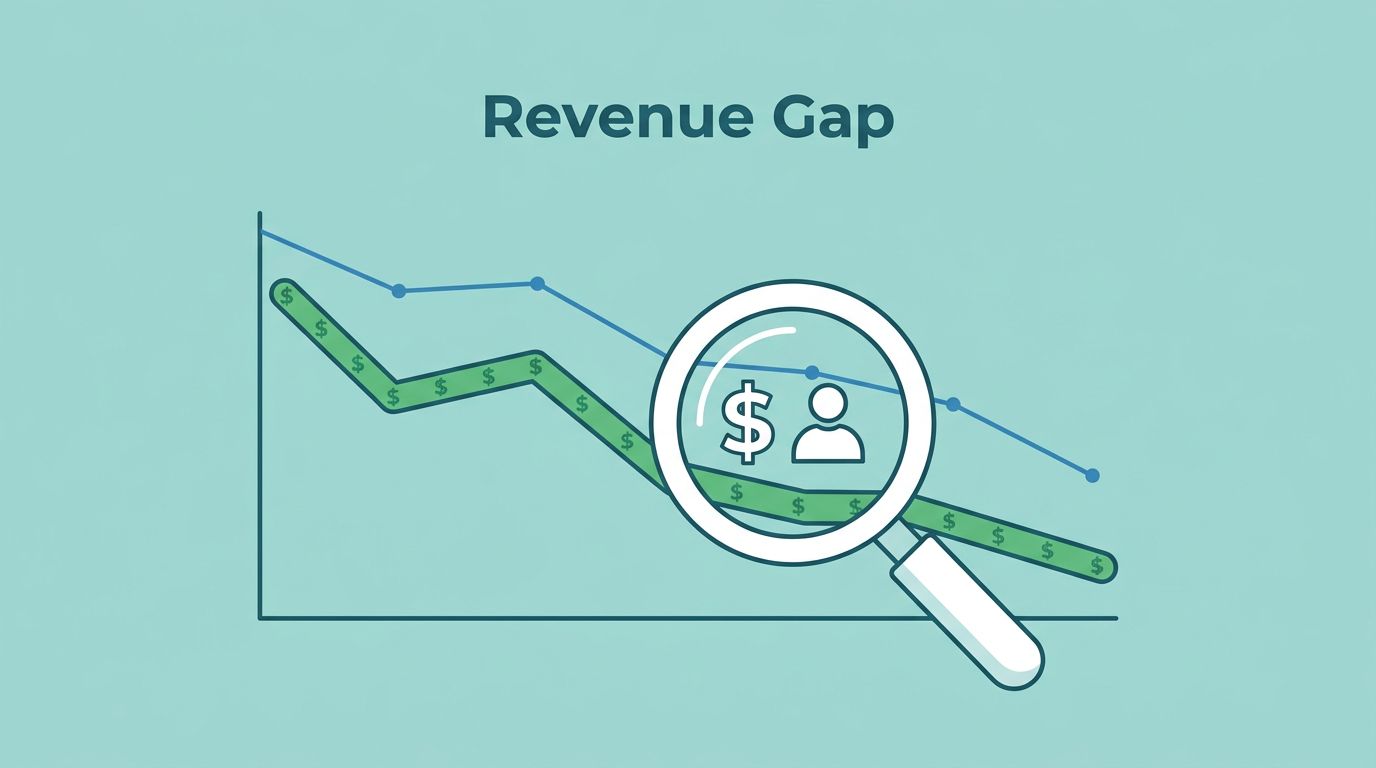
The gap between those numbers often points straight to pricing, plan mix, expansion, or one fragile segment. I start there, because that is where the real story usually sits.
What each churn metric tells me in Baremetrics
In Baremetrics, I look at customer churn as the count of customers lost during a period. Revenue churn is the money tied to those losses, plus the effect of downgrades. That difference matters because a company can lose very few customers and still lose a lot of revenue.
For a plain-English definition, Zendesk’s revenue churn explainer lines up with how I think about it. The number is about lost recurring revenue, not just lost accounts.
I also keep a short metric set beside churn, so I am not reading one number in a vacuum. That is where my essential SaaS metrics for churn reduction view comes in handy.
Here is the way I compare them when I am reviewing Baremetrics data:
| Metric | What it measures | What it can hide | What I look for in Baremetrics |
|---|---|---|---|
| Customer churn | The number of customers lost | Revenue impact from bigger accounts | Which plans or segments are leaving |
| Revenue churn | The MRR lost from churn and downgrades | Small account losses that add up | Which customers, plans, or cohorts drive the drop |
| Expansion MRR | Extra revenue from upgrades and add-ons | Weak retention in some segments | Whether growth offsets churn |
| Contraction MRR | Revenue lost from downgrades | Full cancellations that may be buried | Whether customers stay but spend less |
The table tells the main story. Customer churn shows volume loss. Revenue churn shows value loss. When I read them together, I can see whether I have a broad retention issue or a concentrated revenue problem.
Why the two churn numbers split apart
The two metrics drift apart whenever customer value is uneven. That is normal in SaaS. A small SMB account and a larger enterprise account do not behave the same way, and they do not hurt the business the same way.
Corporate Finance Institute’s churn overview explains the basic math well. I find the practical version easier to remember: count and dollars are related, but they are not the same.
A small logo loss can hide a much larger revenue hit when a few accounts carry most of the MRR.
I can see that clearly in a simple example. If I lose ten low-priced customers, customer churn rises. Yet revenue churn may barely move. If I lose one large account, customer churn may look mild while revenue churn jumps.
That split often comes from one of four places. First, plan mix can tilt the numbers when most customers sit on a cheap tier but a few pay much more. Second, downgrades can push revenue churn up even when the customer count stays steady. Third, expansion can soften revenue churn while customer churn stays ugly. Fourth, a single segment can carry too much weight.
I watch for that pattern because it changes the fix. If the churn gap is wide, I do not reach for a generic retention answer. I look for the pricing or segment shape behind it.
How I use the gap to find the real problem in Baremetrics
Baremetrics is most useful when I read churn next to MRR, active customers, and plan movement. I want the numbers grouped, not scattered. That is why I keep my Baremetrics dashboard view focused on the few metrics that explain retention fast.
When customer churn and revenue churn move in different directions, I sort the problem by segment. That can mean plan tier, acquisition channel, company size, or cohort month. I am trying to answer a simple question: who is leaving, and how much do they matter?
Here is how I interpret the patterns:
- If customer churn rises faster than revenue churn, I usually look at low-ARPU plans, trial users, or a self-serve segment that was never worth much revenue. The business may still feel the pain, but the dollar damage is muted.
- If revenue churn rises faster than customer churn, I check for big accounts, downgrades, and contract changes. One or two accounts may be carrying too much revenue weight.
- If both numbers rise together, I think about product fit, onboarding gaps, support load, or a bad acquisition channel. The customer base is shrinking, and the revenue base is shrinking with it.
- If customer churn is flat but revenue churn climbs, contraction and downgrades are often the first places I look. That pattern usually means customers still want the product, but they want less of it.
I also pay attention to what happens after an upsell. A healthy expansion MRR line can mask weak retention in a specific segment. That does not mean the business is fine everywhere. It means one group may be growing while another is slipping.
The best Baremetrics readout is a clean one. I want to see churn by month, by plan, and by customer value. Then I can spot whether the issue is broad or concentrated. That is much faster than trying to interpret a single top-line churn rate on its own.
What I do with the signal once I see it
A churn gap is only useful if it changes what I do next. When revenue churn and customer churn separate, I treat that as a diagnosis prompt.
If revenue churn is the bigger problem, I look at pricing and packaging first. A weak upgrade path, a sharp price jump, or a limited mid-tier plan can push customers into contraction instead of expansion. In that case, the product may be keeping users, but the plan structure is limiting MRR.
If customer churn is the bigger problem, I look at onboarding and fit. A cheap plan with high logo loss can still hurt growth because it creates support work and wastes acquisition spend. The revenue hit may look small, but the customer experience is still telling me something useful.
If the issue sits in a few accounts, I separate them from the rest of the base. That lets me see whether churn is coming from a narrow segment or from the product overall. A concentrated loss often needs a segment-specific fix, not a company-wide one.
I also use the churn trend when I build a forecast. If contraction keeps rising, I cannot trust a simple growth line. I need a view that includes churned MRR, expansion MRR, and the rate at which different plans move. My Baremetrics financial forecasting guide helps me keep that picture honest.
In practice, I ask three questions. Which segment is leaving? How much revenue does that segment control? And is the loss coming from cancellations, downgrades, or both? Once I answer those, the next move gets much clearer.
Conclusion
Customer churn tells me how many accounts walked out the door. Revenue churn tells me how much money went with them. In Baremetrics, I need both numbers, because each one hides what the other reveals.
The real value is in the gap. When the two move apart, I start looking for pricing issues, segment imbalance, downgrades, or expansion that hides weakness somewhere else. That is where the next decision comes from.
If I read revenue churn and customer churn together, I get a cleaner view of retention, and a better shot at fixing the right problem.