How to Measure Video Vs Image Testing Metrics on Mida.so
Most digital teams face a frustrating paradox. You invest heavily in website traffic acquisition, yet your visitor counts rarely translate into active customer accounts. Bumping up conversions isn’t about guessing what color button wo...


Most digital teams face a frustrating paradox. You invest heavily in website traffic acquisition, yet your visitor counts rarely translate into active customer accounts. Bumping up conversions isn’t about guessing what color button works best today. It requires a systematic approach to user behavior, rigorous testing, and structured experimentation. Mida.so gives you the testing infrastructure you need, but tools only work when you pair them with a disciplined process for creative comparisons.
Evaluating visual assets requires more than watching a top-level conversion percentage tick upward. Whether you are comparing a static hero banner against an engaging product walkthrough or assessing different visual formats, your analysis must look deeper. When you run a video vs image testing campaign, you need to track primary business outcomes alongside performance guardrails to ensure your creative choices actually drive revenue.
Key Takeaways
- Establish baseline conversion rates and traffic stability before launching any new visual experiment on your landing pages.
- Formulate clear hypotheses based on user friction points rather than random design tweaks.
- Monitor segment performance across mobile devices and paid traffic sources instead of relying solely on aggregate totals.
- Define strict decision rules and statistical confidence thresholds before checking live test results to prevent false positives.
- Document every winning and losing test outcome to build a reliable internal knowledge base for future campaigns.
Understanding the Role of Visual Assets in Conversion Experiments
Static images and dynamic video clips serve very different purposes on a high-intent landing page. An image loads instantly, anchors the hero section, and directs attention toward your primary call to action. A video engages users longer, explains complex workflows, and answers objections before a prospect ever scrolls down the page.

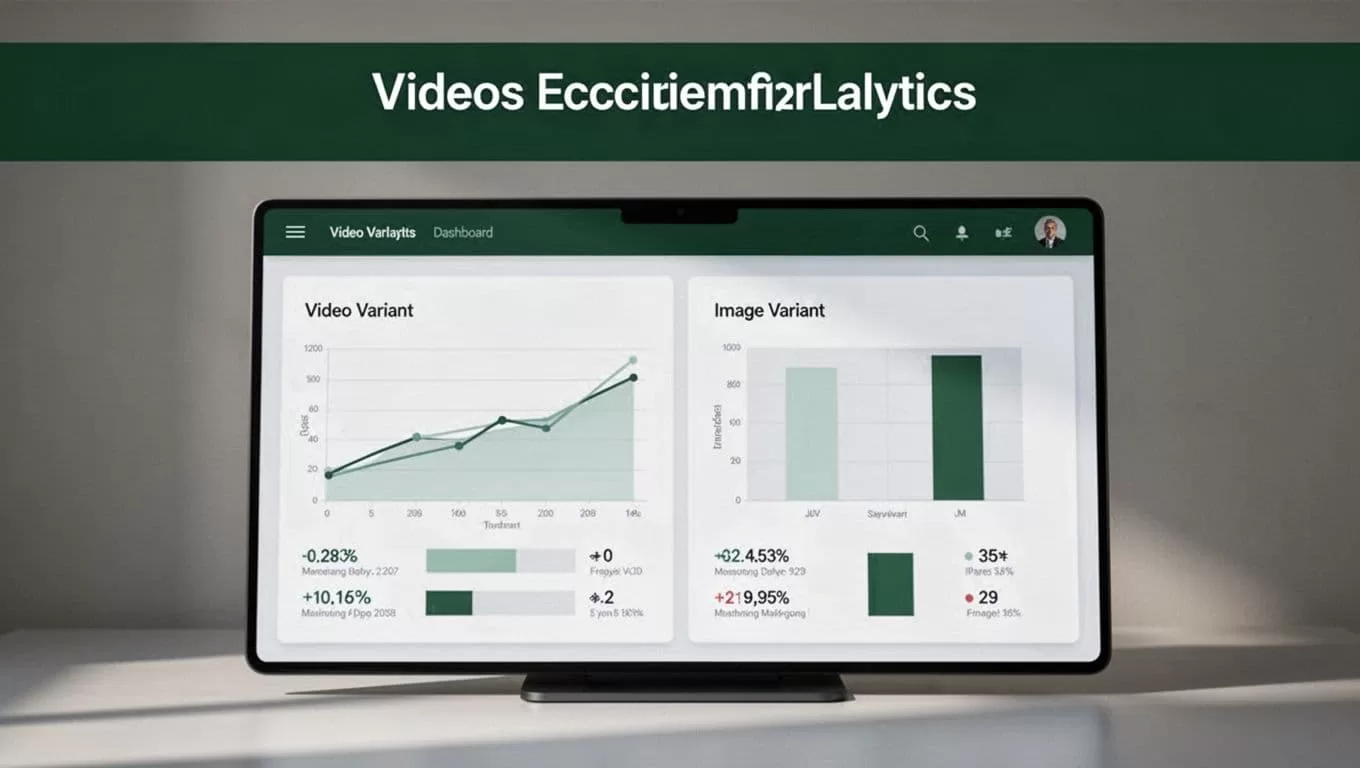
Running a comparative test means measuring how these distinct asset types alter user behavior. You aren’t just testing aesthetics. You are testing how quickly a visual element communicates value and motivates action. When growth teams set up these variations, they often use the Mida.so platform to manage variant routing and goal tracking asynchronously, ensuring that site performance remains protected. For a broader perspective on running structured experiments, review this conversion rate optimization A/B testing guide.
Defining Primary Conversion Goals and Secondary Metrics
A successful experiment starts with a single primary metric tied directly to your business model. If your page sells software subscriptions, your primary goal is a completed trial signup or a demo request. When you pit a video variant against a static image, the video might increase on-page engagement time while accidentally depressing form submissions if it pushes the call to action below the fold.
You must track secondary guardrail metrics to catch these hidden trade-offs. Watch your form completion rates, bounce rates, and core page speed metrics. Heavy video files can introduce rendering delays that frustrate mobile visitors. To protect your site performance and understand how load times impact visitor behavior, check the analyzing ab test results documentation. If your video asset slows down initial page rendering, the engagement lift might not cover the revenue lost from impatient users abandoning the session.
Setting Up a Fair Creative Test
Comparing different visual formats requires identical test conditions to produce reliable data. If you route all mobile traffic to the video variant and desktop traffic to the image variant, your data becomes completely useless. Your traffic allocation needs a clean fifty-fifty split across the exact same audience segments.
Before launching your variants, write out your core hypothesis using a structured format. State the observed visitor problem, the specific asset change you are making, and the metric you expect to improve. For more insights on how structured hypotheses improve experimentation outcomes, explore how to increase conversion rates with A/B testing. Keep your targeting rules strict and avoid altering traffic distribution while the experiment is active.
Segmenting Your Performance Data
Blended averages hide the true story behind your creative tests. A static image might win overall because it appeals to fast-moving desktop users, while the video variant dominates among high-value enterprise prospects arriving from paid search campaigns.
Break your report down by key audience dimensions before declaring a winner:
- Mobile visitors who face unique screen real estate constraints and potential network latency issues.
- Paid traffic arriving from ad platforms with specific intent matching your core offer.
- Returning users who already understand your basic product proposition and navigate pages faster.
- Organic visitors arriving from search engines with informational intent.
Review absolute conversion numbers alongside percentage changes. A minor lift derived from a handful of transactions can easily trick an eager team into deploying a losing variant. Wait until you hit your required sample size before making permanent updates. For comprehensive advice on designing and executing tests, consult the ultimate conversion rate optimization guide.
Establishing a Decision Framework for Your Creative Test
Too many teams declare a test winner based entirely on a raw statistical significance percentage. A report needs more than a headline lift to justify permanent deployment. Compare your control group against the variant under identical conditions, and check whether the winning metric holds steady across key audience segments.
Store your final results, hypotheses, and implementation notes in an internal testing log so your team never runs the same inconclusive experiment twice. If a video variant wins, define the permanent implementation plan for your development team. If it loses, record exactly what the data rules out.
Conclusion
Measuring visual experiments requires balancing engagement lift against technical performance and down-funnel revenue. When you ground your analysis in segmented data and strict business rules, conversion optimization turns into a predictable growth engine. Open your Mida.so dashboard today, review your active visual tests, and base your next creative decision on reliable evidence.

