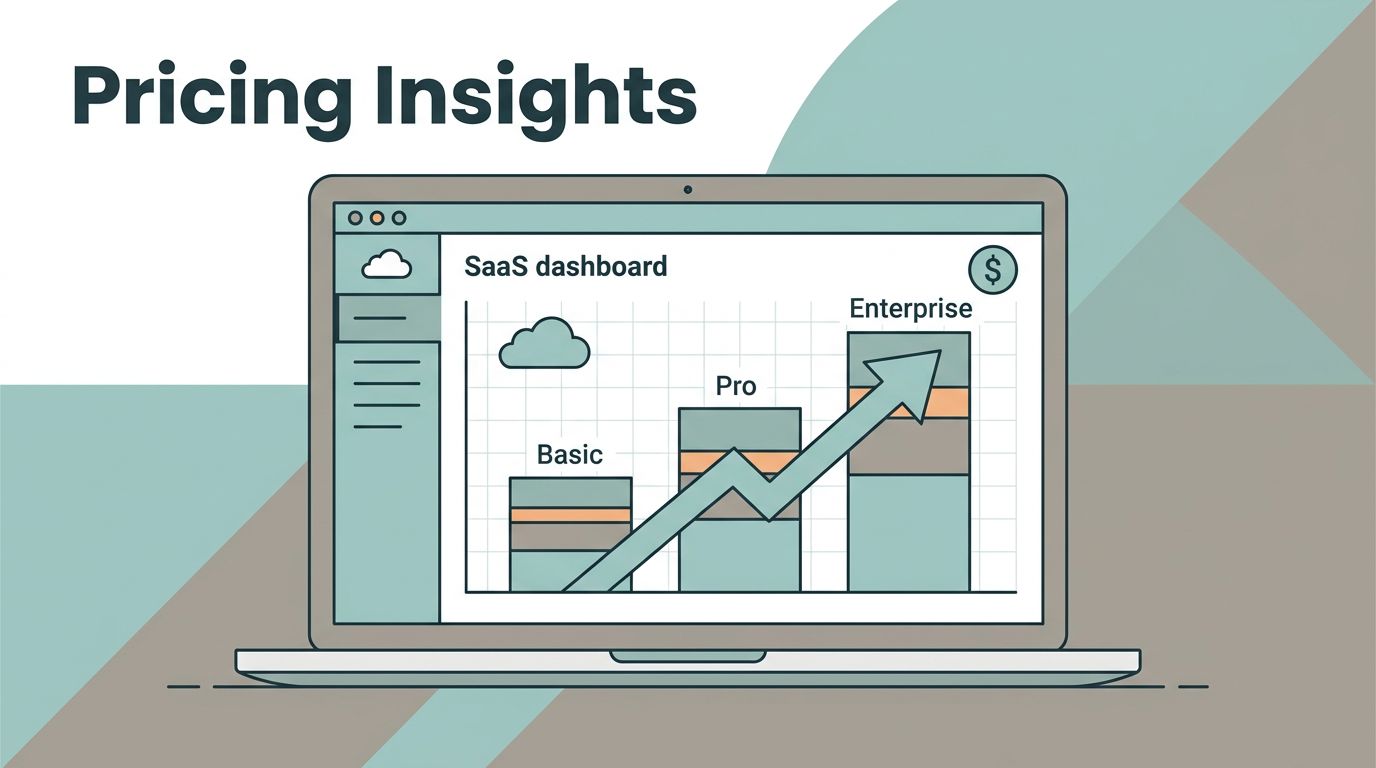
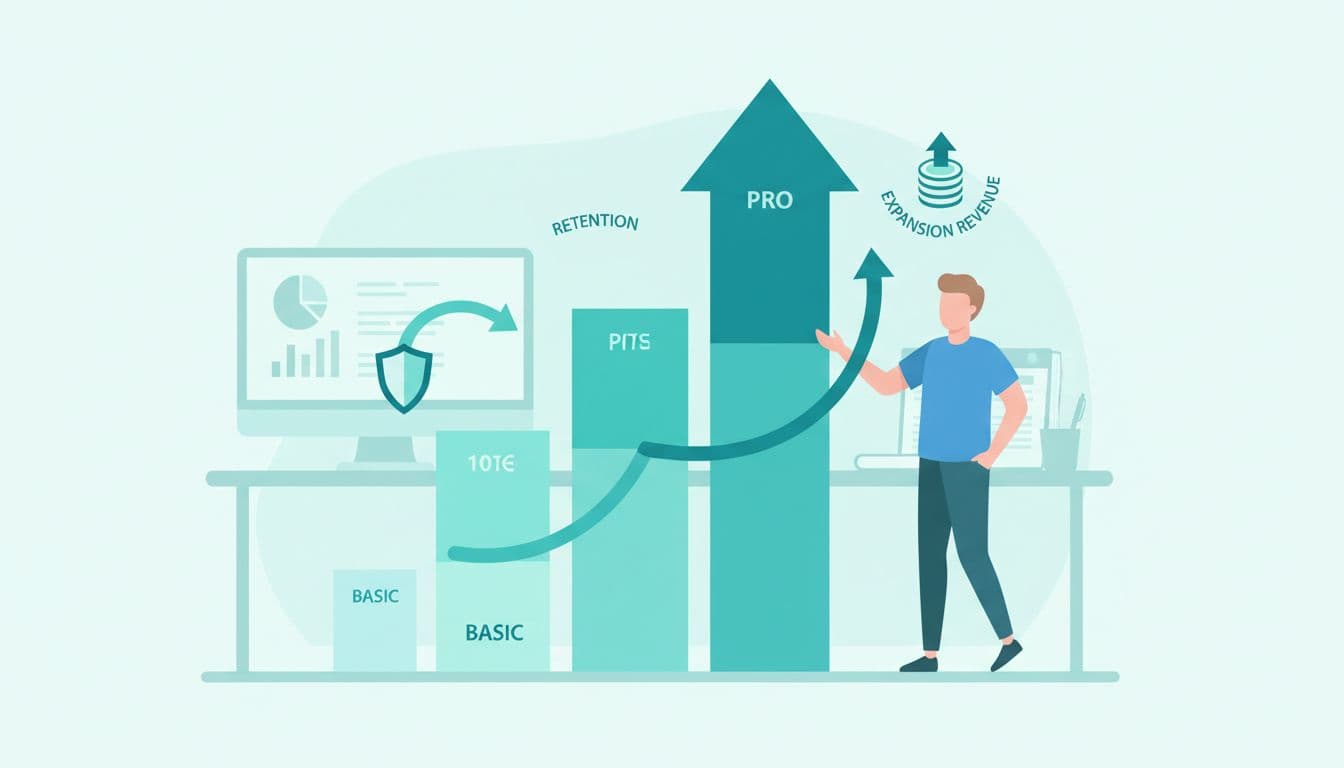
You’ve set up three pricing tiers for your SaaS product. Basic draws in users. Pro unlocks key features. Enterprise promises unlimited scale. But are they working? I check Baremetrics data to see if those tiers spark upgrades, hold retention, and fuel expansion revenue.
As a SaaS founder, I connect Baremetrics to Stripe and watch the numbers. Total MRR looks fine until I slice it by tier. That’s when patterns emerge. Some tiers leak revenue. Others pull customers up the ladder. In this post, I share how I spot those signals and fix weak spots.
Let’s start with what Baremetrics pricing tiers tell me about business health.
What Baremetrics Reveals About Your Pricing Tiers
I pull up Baremetrics and filter MRR by plan. Basic tier holds 60% of customers but just 25% of revenue. Pro carries 30% of users and 50% of dollars. Enterprise grabs the rest. This mix shows promise if Pro and Enterprise grow faster than Basic.
Baremetrics breaks revenue into streams. New MRR comes from fresh signups. Expansion MRR hits when users upgrade. Contraction MRR flags downgrades. Churned MRR tracks losses. I compare these across tiers. For example, if Basic churns at 10% monthly while Pro sits at 4%, my entry tier needs work.
Retention curves tell another story. Customers on annual Pro plans stick 92% longer than monthly Basic ones. Baremetrics pulls this from Stripe in real time. No waiting for spreadsheets.
I also check ARPU by tier. Basic averages $29. Pro jumps to $99. Enterprise clears $499. But if ARPU flatlines on Pro, users grab features without paying more. Time to tighten gates.
Benchmarks help too. Baremetrics benchmarks show most SaaS firms run 4-5 tiers with ARPU spread similar to mine. If my expansion lags peers, I dig deeper.
This view connects pricing to outcomes. Weak tiers drag growth. Strong ones build momentum.
Key Metrics to Track for Pricing Success
Focus on MRR components first. I set Baremetrics to show new, expansion, contraction, and churned MRR by tier. Healthy SaaS sees expansion outpace contraction by 2x. If Basic feeds upgrades but Enterprise stalls, cap features there.
Next, ARPU trends. Plot it monthly per tier. Rising ARPU on Pro means users see value. Flat lines signal pricing mismatches.

Churn rate by tier reveals leaks. Basic often hits 8-10% monthly. Pro should drop below 5%. Baremetrics segments this by cohort. January Basic signups churn fast. June Pro ones renew steadily. Why? Onboard them better.
Trial-to-paid conversion rounds it out. If 20% of Basic trials upgrade but Enterprise trials convert at 5%, simplify high-end sales.
I track these in custom dashboards. Baremetrics Launch plan at $75/month gives basics. Growth at $255 adds segments and benchmarks. Use Baremetrics metrics list for the full 28.
These metrics tie tiers to revenue. Watch them weekly.
Spotting Upgrade Patterns in Baremetrics Data
Upgrades turn Basic users into Pro payers. I filter Baremetrics for expansion MRR. Last quarter, 15% of Basic customers moved up. That added $12K MRR. Pro to Enterprise? Just 8%, or $8K.
Look at timing. Upgrades spike month three. Users hit limits then. Retention follows. Upgraders stay 18 months versus 9 for stay-put Basic folks.
Cohorts sharpen this. Segment by signup channel. SEO Basic users upgrade twice as often as paid ad ones. Nudge ads toward Pro trials.
Downgrades warn early. If Pro drops to Basic after 60 days, features overwhelm. Baremetrics flags these in contraction views.
For expansion revenue, annual plans shine. They retain 92% versus 68% monthly, per recent data. Push switches with discounts.
I cross-check with Baremetrics price analysis guide. It matches my findings: tier funnels predict growth.
Patterns like these guide tweaks. More upgrades mean better tiers.
In my work, I follow Baremetrics pricing metrics for SaaS analysis to track MRR quality by plan.
Common Mistakes I Avoid in Tier Analysis
Many founders chase total MRR. Big mistake. It hides tier issues. Basic bloats headcount but starves revenue. Focus on components instead.
Ignore cohorts? Another trap. Overall ARPU rises, but new cohorts churn high. Baremetrics cohorts show this fast.

Overlook billing cycles hurts too. Monthly tiers churn at 8.5%. Annuals hold steady. Segment data or miss the fix.
Skip benchmarks. Your 5% Pro churn seems fine until peers average 3%. Baremetrics SaaS benchmarks provide context.
Rely on gut for upgrades. Data shows Basic-to-Pro paths. Guesswork wastes time.
I dodge these by starting with four MRR streams. Then layer segments. Simple habit, big payoff.
Best Practices for Pricing Tier Analysis
Start small. Connect Baremetrics to Stripe. Pick Metrics module at $208/month. Add Recover for $158 if dunning losses mount.
Monitor weekly. Set alerts for 10% swings in expansion MRR. Compare pre- and post-price change.
Test one tier. Raise Pro 20%. Watch trial conversions and upgrades for 30 days. Baremetrics shows impact daily.
Segment ruthlessly. By tier, tenure, channel. Annual Pro users expand 3x monthly ones.
Use forecasts. Forecast+ comes free with Metrics. Model tier shifts on future MRR.
Benchmark often. If Enterprise ARPU lags, check tiered pricing models.
For deeper setup, see my Baremetrics metrics for churn protection.
Push annual billing. Data proves it cuts churn. Offer 20% off.
Review quarterly. Tie findings to roadmaps. Weak tiers get culled.
These steps build revenue from tiers.
Conclusion
Baremetrics pricing tiers expose what drives your SaaS forward. I track MRR streams, ARPU lifts, and upgrade paths to confirm tiers fuel growth.
Expansion and retention beat new logos alone. Fix leaks there first.
Strong tiers compound revenue. Check yours today.