MRR reports can look simple until a filter is off by one month. Then the whole story shifts.
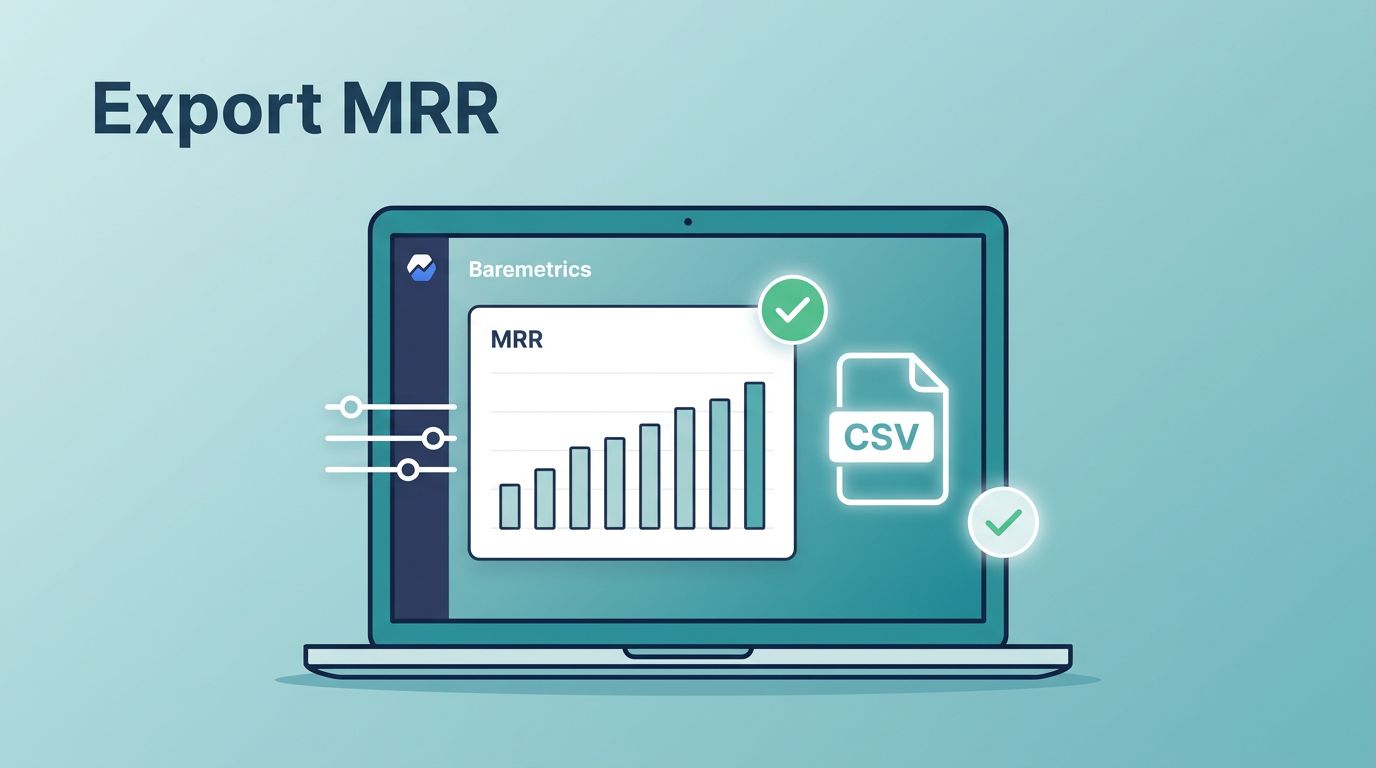
When I need to explain revenue to a founder, finance lead, or investor, I want more than a screenshot. I want a CSV I can sort, check, and trust. That is where exporting MRR data from Baremetrics becomes useful.
The path is short, but the details matter. I care about the report type, the filters, and how I confirm the file after it downloads.
What MRR data means inside Baremetrics
In Baremetrics, MRR is the recurring part of subscription revenue. I use it to see how much stable monthly revenue I have, and where that number changed.
That export can be broad or narrow. Sometimes I want a monthly trend for the whole business. Other times I want customer-level MRR, especially when I am tracing upgrades, downgrades, or cancellations.
I also like to keep my live view close at hand. A customizing your Baremetrics dashboard view helps me compare the exported file with the numbers I already see in the product.
If the source data is messy, the export will carry that mess with it. For that reason, I treat the export as a mirror, not a fix.
When I export MRR data
I usually export MRR when I need to move beyond the dashboard. Monthly close is one moment. Board prep is another. Due diligence calls for it too.
I also export when a number looks off. A sudden dip can come from a real churn event, but it can also come from a filter mistake or a sync delay. The file gives me something I can inspect row by row.
Here are the moments that come up most often for me:
- Month-end reporting: I want a clean snapshot I can drop into a finance workbook.
- Investor updates: I need a defensible number with a clear trail.
- Churn review: I want to see which customers moved and why.
- Pricing analysis: I compare expansion, downgrades, and plan changes.
- Long-term planning: I use the export for trend lines and forecasts.
If I can’t explain why a number changed, I don’t export yet. I fix the filter or the source first.
Baremetrics also documents the current export flow on its data exports help page. The export update notes that exports are request-based and available on demand.
What I check before I click export
Before I export anything, I slow down for a minute. That saves me from chasing bad numbers later.

I start with the report itself. I need the right MRR view for the question I’m asking. A broad company view is not the same as a customer-level export.
Then I check a few basics:
- Date range: I make sure the first and last months match the story I need.
- Segment or filter: I confirm the export is limited to the right group, if I am filtering by plan, customer type, or another slice.
- Currency: I look for the right currency context before I share the file.
- Source sync: If I recently changed billing data, I wait for Baremetrics to catch up.
- Live dashboard match: I compare the export plan with my dashboard view before I run anything.
If my Stripe setup is off, I don’t expect the export to save me. I make sure the Baremetrics Stripe integration is healthy first, because the file can only reflect what Baremetrics has received.
That extra minute is boring in the best way. It keeps my reporting calm later.
How I export the report in Baremetrics
The current flow is straightforward. I go to Settings, then Data Exports, and choose the MRR report I need. From there, I set the filters and request the file.
The steps look like this:
- Open Settings, then Data Exports.
- Pick the MRR report type that matches my goal.
- Adjust the filters I need, such as date range, segment, or years.
- Click Export Data.
- When the export finishes, download the most recent file.
Baremetrics exports the result as a CSV file, which is what I want most of the time. CSV opens cleanly in Excel, Google Sheets, and most BI tools.
I also keep the request limit in mind. Baremetrics allows exports up to six times per day per report type, so I do not rerun the same file over and over unless I need to. That limit pushes me to plan the export well the first time.
If I know I will need this data again and again, I start thinking about automation. For a one-off report, though, the manual export is enough and usually faster than building a heavier pipeline.
How I validate the CSV after download
The download is not the finish line. It is the start of my check.
I open the CSV right away and look for signs that the numbers make sense. A clean file should line up with the dashboard, the date range I chose, and the business event I was tracking.
This is the quick check I use most often:
| Check | What I look for | Why it matters |
|---|---|---|
| Date range | The first and last period match my request | Prevents missing or extra months |
| Customer rows | The count matches the segment I selected | Confirms the filter worked |
| Totals | Export totals line up with the Baremetrics view | Catches sync or report mismatches |
| Blank cells | Missing values are rare and explainable | Keeps formulas and pivots stable |
| Number format | Currency and decimals look consistent | Avoids spreadsheet errors later |
I compare the file with my Baremetrics dashboard view before I share anything. If the totals differ, I check the filters first. Only after that do I look for source-data problems.
Small errors show up fast in a CSV. That is useful. A broken month or missing customer is easier to spot in a spreadsheet than in a chart.
What I do with the export in spreadsheets and BI tools
Once the file passes my check, I use it in three ways.
The first is a spreadsheet. In Google Sheets or Excel, I can sort customer MRR, build pivots, and add notes beside each change. That works well for finance close and ad hoc review.
The second is BI. I load the export into a tool when I need trend lines, recurring reports, or a shared dashboard for the team. The CSV gives me a clean starting point, even if the rest of the reporting stack is more complex.
The third is internal reporting. I paste the key numbers into a weekly memo or board update so the team can see what moved. That keeps everyone focused on the same figures instead of debating screenshots.
Here is a simple way I think about each use case:
| Destination | What I do with the export | Best fit |
|---|---|---|
| Spreadsheet | Build pivots, formulas, and notes | Finance review and manual analysis |
| BI tool | Blend MRR with product or CAC data | Trend analysis and dashboards |
| Internal report | Summarize the key changes | Team updates and board prep |
The file becomes more useful when I pair it with other data. MRR by itself tells me what happened. MRR plus product usage, churn notes, or campaign spend tells me why it happened.
That is where the export earns its keep. It moves the conversation from a number on a screen to a file I can work with.
The export is only as good as the source
When I need MRR data from Baremetrics, I focus on three things: the right report, the right filters, and a clean validation pass after download. That keeps the file useful instead of decorative.
The process is simple enough to repeat, but the review step is what protects me. A CSV that matches the dashboard can move into spreadsheets, BI tools, and internal reporting without extra drama.
Once I trust the export, I stop thinking about the download path and start thinking about the story in the numbers. That is the real win.