How to Measure AB Test Statistical Significance in Mida.so
A winning variation isn’t useful if the result could be random. You need AB test statistical significance to decide whether Mida.so has found a reliable difference between your control and variation. Mida.so gives you the performance...
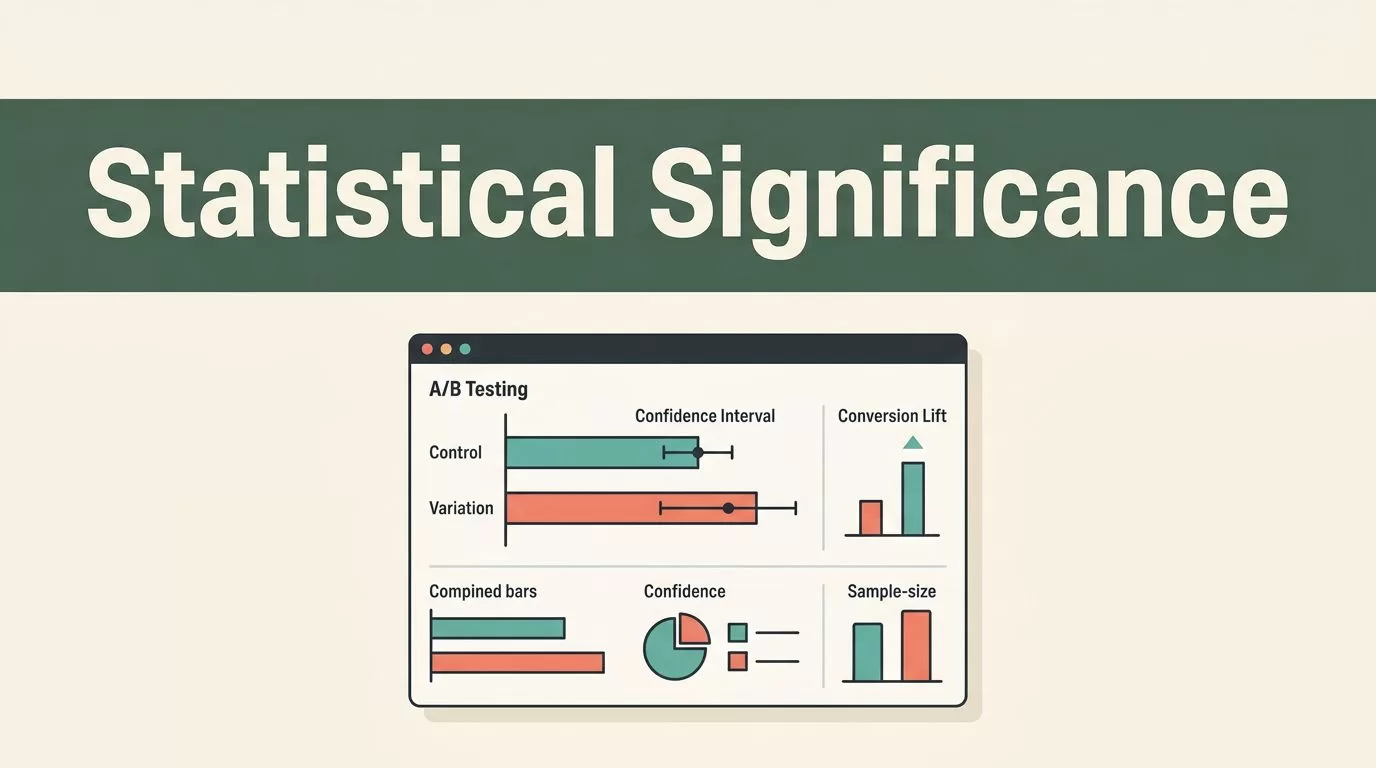
A winning variation isn’t useful if the result could be random. You need AB test statistical significance to decide whether Mida.so has found a reliable difference between your control and variation.
Mida.so gives you the performance data. Your job is to read that data in context. Check the confidence level, conversion lift, sample size, test duration, tracking quality, and segment results before you ship a change.
Key Takeaways
- Statistical significance tells you whether a result is unlikely to come from random variation.
- A high confidence result doesn’t automatically make a small lift valuable.
- Run tests through a complete business cycle and avoid stopping after an early spike.
- Check data quality, primary metrics, and segment consistency before declaring a winner.
- Use Mida.so as a decision tool, not as permission to stop testing without judgment.
What Statistical Significance Means in an A/B Test
An A/B test compares two experiences. The control is the current version. The variation includes the change you want to evaluate.
Mida.so measures how each version performs against a chosen goal, such as form submissions, purchases, sign-ups, button clicks, or another tracked conversion. It then estimates whether the difference is large enough to separate from normal random noise.
Random noise appears in every experiment. One version may receive more returning visitors on a given day. A paid campaign may send unusually qualified traffic to one group. A small sample can also produce a large-looking difference that disappears later.
Statistical significance answers one narrow question:
If the control and variation were equally effective, how unusual would this observed result be?
A low probability under that assumption supports the idea that the versions perform differently. A high probability means the current data doesn’t provide enough evidence to call a winner.
Most A/B testing reports express this result through a confidence percentage or a p-value. A result near 95% confidence is often used as a practical threshold. That doesn’t mean there’s a 95% chance the variation is better. It means the observed difference would be relatively unlikely if no real difference existed.
The calculation usually considers four inputs:
- The number of visitors assigned to each version.
- The number of conversions from each version.
- The conversion rate for each version.
- The size of the observed difference.
More visitors and more conversions usually produce a more stable estimate. A large traffic count with very few conversions can still create an uncertain result.
Mida.so handles the statistical calculation inside the experiment report. You still need to understand what the number does and doesn’t tell you.
Prepare the Mida.so Test Before Measuring Significance
Statistical analysis can’t repair a poorly designed test. Start with a clean experiment setup.
Choose one primary conversion goal before you launch. If your test focuses on checkout completion, don’t switch the main metric to add-to-cart events after seeing the first results. Secondary metrics can provide context, but the primary goal should drive the decision.
Define the change clearly. A new headline, shorter form, pricing layout, and faster checkout flow are different tests. Combining several major changes makes the result harder to interpret because you won’t know which change caused the outcome.
Set the audience and traffic allocation before collecting data. The control and variation need comparable visitor groups. If one version receives mostly mobile visitors and the other receives mostly desktop visitors, the comparison may reflect device behavior instead of the page change.
Check your tracking before launch. Use a test visitor to confirm that Mida.so records the page view, assignment, and conversion correctly. Pay attention to:
- Duplicate conversion events
- Missing events on single-page applications
- Cross-domain checkout tracking
- Consent settings that block measurement
- Internal staff, bots, and test traffic
- Visitors who enter the test but never receive a valid variation
Write down the hypothesis, primary metric, audience, expected impact, and planned test window. This record limits post-test bias. It also stops the team from changing the rules after the report starts to look favorable.
Your sample size depends on baseline conversion rate, expected lift, traffic volume, and the confidence threshold you choose. A low-conversion goal needs more visitors than a high-volume click goal because fewer events are available for comparison.
How to Read Statistical Significance in Mida.so
Open the relevant experiment in Mida.so after it has collected enough traffic to produce a useful comparison. Review the control and variation side by side.
Start with the raw counts. Look at visitors and conversions for each version. Then review the conversion rate, relative uplift, absolute difference, and confidence or significance indicator shown in the report.
Use this order:
- Confirm that both versions received traffic.
- Compare visitor counts and conversion counts.
- Check the primary conversion rate.
- Review the reported uplift.
- Read the confidence or significance result.
- Inspect the test dates and traffic sources.
- Review important segments before making the decision.
Suppose the control converts at 10% and the variation converts at 10.3%. The variation has a 3% relative lift, but only a 0.3 percentage-point increase. That may produce a significant result with enough traffic. It may still have limited commercial value if the page receives little traffic or the change is expensive to maintain.
Now consider the opposite case. A variation converts at 12% while the control converts at 10%. That is a large visible difference. If each version has only a small number of visitors, Mida.so may show low confidence. The gap looks promising, but the evidence is weak.
Treat the confidence result as evidence, not a verdict. A common interpretation looks like this:
| Mida.so result | Practical reading |
|---|---|
| Low confidence | The data doesn’t separate the versions reliably |
| Moderate confidence | The variation may be promising, but more data is needed |
| Around 95% confidence | The result meets a common decision threshold |
| High confidence with small lift | The difference may be real but commercially minor |
| High confidence with tracking problems | Fix the data before trusting the result |
Check whether the test has run through a complete weekly cycle. B2B websites may receive different traffic on weekdays and weekends. Paid campaigns, product launches, paydays, holidays, and sales promotions can also distort results.
Don’t stop because one day looks strong. Daily performance is useful for monitoring broken tracking or severe problems. It isn’t a reliable basis for declaring a winner.
Statistical Significance Is Only One Part of the Decision
A significant result can still lead to a poor business decision. Review four additional factors before deploying the variation.
Practical significance
Statistical significance asks whether the difference is likely to be real. Practical significance asks whether the difference matters.
A variation that adds 0.2 percentage points may be valuable on a high-volume checkout. It may not justify engineering work on a low-traffic page. Calculate the expected number of additional conversions and compare that value with implementation and maintenance costs.
Consider the quality of the conversion too. More form submissions don’t help if the variation attracts unqualified leads. Check revenue, activation, retention, refund rates, or sales-qualified leads when those metrics are available.
Test duration
A test needs enough data across normal operating conditions. Time alone isn’t enough. A three-week test with very little traffic may still be inconclusive. A high-volume test can collect strong evidence faster, but early results can still reflect campaign or audience changes.
Run the experiment through the traffic patterns that matter to your business. Include the normal weekday cycle, major device types, and relevant acquisition channels.
If a major campaign changes the audience during the test, record the date and review the results separately. Don’t treat the full period as one consistent sample without checking what changed.
Data quality
Inspect the implementation before trusting Mida.so’s result. A significant difference caused by missing variation conversions is not a winning experiment.
Look for sudden changes in event volume. Compare Mida.so data with your analytics platform, payment system, CRM, or backend order records where possible. Small differences between systems are normal. Large unexplained gaps require investigation.
Also check sample ratio mismatch. If the test is designed to split visitors evenly but one version receives far more traffic, the assignment or targeting setup may be wrong. Pause the decision and fix the allocation problem first.
Segment consistency
A variation can perform well overall and fail for an important audience. Review mobile and desktop visitors, new and returning users, major traffic sources, geographic markets, and customer types that matter to the business.
Don’t search through dozens of segments until you find one significant result. That creates a multiple-comparisons problem. The more groups and metrics you inspect, the higher the chance of finding a random difference.
Use segments to explain the main result and identify risks. Treat small segment findings as directional unless they have enough traffic and a clear business reason for separate analysis.
Avoid These Common A/B Testing Errors
Peeking creates pressure to stop early. Teams often check Mida.so every few hours, see a temporary lead, and announce a winner. Daily checks are fine for quality control. They shouldn’t change the planned stopping rule.
Repeated testing weakens the original claim. If a test fails to reach significance, don’t keep extending it indefinitely until the number crosses a threshold. Set a decision window before launch. If the result remains unclear, record it as inconclusive and design a stronger follow-up test.
Changing the primary metric invalidates the comparison. A variation may lose on purchases but win on clicks. Choose the metric that reflects the actual business outcome before launch.
Running too many changes at once reduces learning. A complete redesign may increase conversions. It won’t tell you which individual change deserves further use.
Ignoring guardrail metrics creates hidden damage. Monitor error rates, page speed, revenue per visitor, lead quality, and downstream behavior when they can be affected by the test.
A clean test process has a simple rule: fix broken data, keep the test running through the planned window, and judge the final result against a pre-defined business decision.
A Practical Mida.so Decision Framework
Use the Mida.so report to answer these questions in order:
- Did both versions receive valid and comparable traffic?
- Did the primary conversion event record correctly?
- Did the test run across the required business cycle?
- Is the confidence level strong enough for your decision rule?
- Is the uplift large enough to matter financially or operationally?
- Does the result hold across important segments?
- Did any guardrail metric decline?
If the answer to the first three questions is no, don’t interpret the winner yet. If confidence is low, keep the test running or mark it inconclusive. If confidence is high but the lift is small, compare the expected value with the cost of rollout.
Use a staged rollout when the change affects revenue, onboarding, or a high-risk customer flow. Monitor the same primary and guardrail metrics after deployment. A test result is evidence for a decision, not a guarantee that performance will remain unchanged.
Conclusion
Mida.so can calculate the statistical difference between your control and variation, but the dashboard can’t make the full decision for you. AB test statistical significance is one check in a larger process that includes sample size, test duration, data quality, practical lift, and segment behavior.
Don’t declare a winner after an early spike. Confirm that the data is clean, the result meets your threshold, and the improvement matters to the business. A reliable test produces more than a high confidence number. It produces a decision you can defend.
