App store dashboards can show a spike, but they often hide the bill.
I can see downloads, trials, renewals, and cancellations inside native tools, yet I still miss the full revenue story when billing moves across plans, regions, or channels. That is why I treat Baremetrics as an app store analytics alternative when the question is about money, not just store activity.
If I need traffic, I look at the store. If I need MRR, churn, and LTV, I look at Baremetrics.
Why native app store analytics stop short
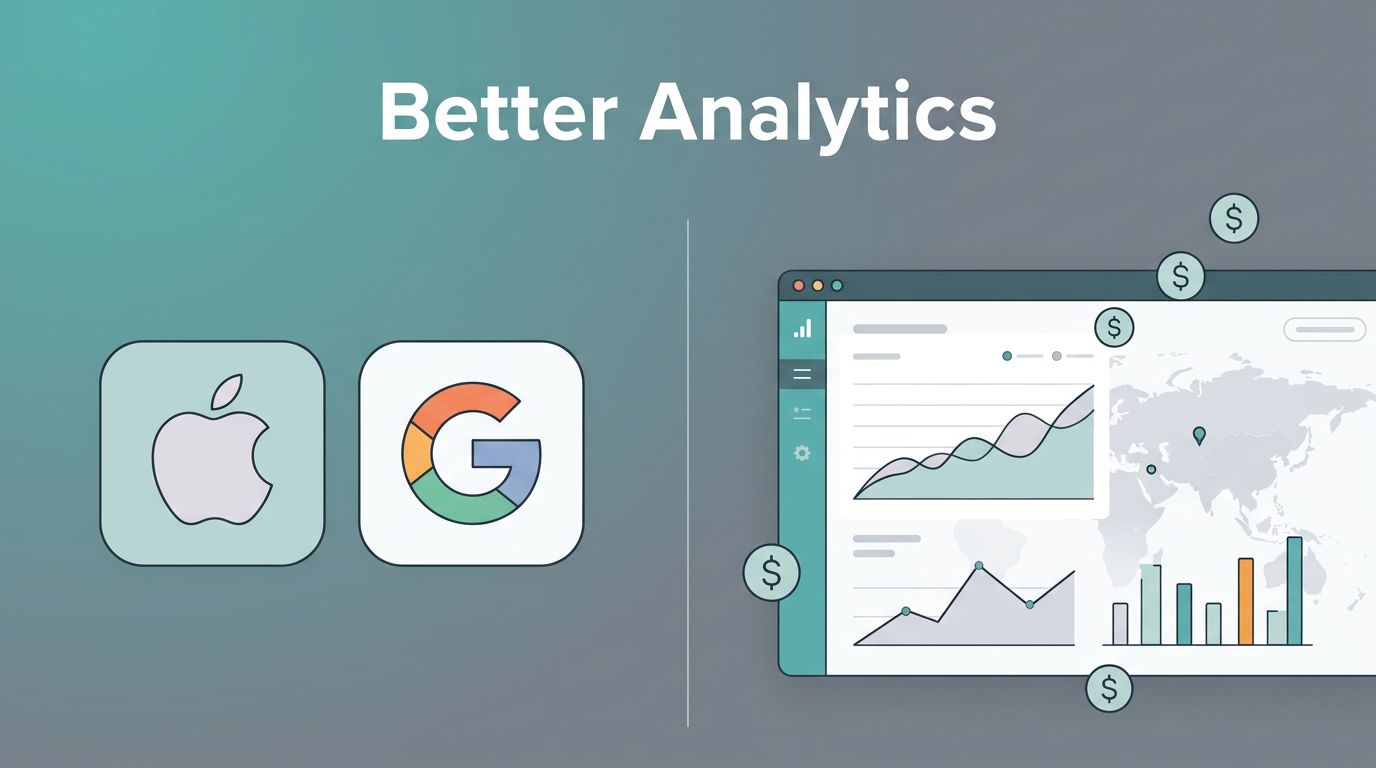
I still keep native store analytics open for acquisition work. Apple’s App Store Connect analytics is built for app performance, so it helps me watch acquisition, retention, monetization, and quality inside one store.
Apple has also added more subscription detail, including churn and renewal views, in updated subscription metrics in App Store Connect. That helps, but the lens is still tied to the store. It does not solve the mess of fees, refunds, taxes, or regional rules that change the net result.
I also run into delays. Native tools can be good at showing what happened, but weaker at showing why it happened or what to do next. That gap gets wider when I compare iOS with Android, or when web billing sits next to in-app purchases. The App Store analytics limits guide explains the same problem well, store data reports outcomes, but not the full story behind them.
This is the split I care about most.
| Question I need answered | Native app store analytics | Baremetrics |
|---|---|---|
| Where did the install come from? | Strong for store-level acquisition | Not its main job |
| What happened after signup? | Shows some subscription events | Shows MRR, ARR, churn, and LTV |
| How healthy is each segment? | Limited and platform-bound | Segment by plan and customer group |
| Can I forecast next quarter? | Weak for planning | Built for revenue forecasting |
| Can I trust the revenue view? | Often gross and store-specific | Built for subscription revenue clarity |
That split is the whole story. I keep store analytics for acquisition and conversion work. I reach for Baremetrics when I need a clean revenue answer I can trust.
What Baremetrics gives me instead
Baremetrics is the tool I want when subscription reporting has to feel like a dashboard, not a scavenger hunt. I use it for MRR, ARR, churn, LTV, ARPU, and net revenue retention because those numbers tell me whether the business is growing in a healthy way.
When I want to catch churn before it spreads, I lean on tracking key revenue metrics. I watch new, expansion, contraction, and churned MRR together. A single line chart can look fine while the mix underneath gets worse. Baremetrics helps me see the mix.

I also pay close attention to segmentation. A strong average can hide weak plans, weak cohorts, or a customer group that is quietly slipping away. If one premium tier is expanding while a lower tier is canceling, the average may still look fine. That is why I do not read MRR alone. I read it beside churn, LTV, and segment data.
Forecasting matters for the same reason. I want a view of what the next few months could look like, but I do not treat a forecast like a promise. It is a planning tool, not a crystal ball. Still, it is far more useful than staring at store totals and guessing.
I trust the dashboard that shows which customers are growing the business, not just which ones arrived.
For the layout itself, I like building effective revenue dashboards. Clear dashboards save time. They also keep me from mixing growth signals with noise. Baremetrics works best when I use it as the revenue layer, not the only analytics layer in the stack.
When I would choose Baremetrics over store analytics
I usually choose Baremetrics first when at least one of these is true:
- I sell subscriptions across web and mobile, and I want one revenue view.
- I care more about churn, expansion, and LTV than download counts.
- I need reports that a founder, finance lead, or investor can read fast.
- I run pricing tests, offers, or paywall changes and need to see revenue impact.
- I want forecasting that starts with billing data, not store traffic.
That list is where the fit becomes obvious. If my job is to understand app-store performance, native analytics still matter. If my job is to understand the business, Baremetrics gives me the sharper lens.
I also like it when I need dashboard clarity. A good revenue report should feel like a clean desk. I should see the important numbers first, then the supporting detail, without pulling five exports into a spreadsheet rescue mission. Baremetrics is built for that kind of reading.
How I use both tools without mixing their jobs
I split the work on purpose. Store analytics own the top of the funnel, while Baremetrics owns the billing layer. That keeps reports cleaner and stops me from double counting the same customer story in two places.
- I use native store tools to watch acquisition, retention, and app behavior.
- I use Baremetrics to track MRR, ARR, churn, LTV, and segment changes.
- I compare both on a weekly cadence, but I make financial decisions from the revenue view.
That workflow keeps me honest. If a store chart looks strong but revenue stalls, I know the problem is deeper than traffic. If Baremetrics shows healthy growth, I know the business is compounding, even if one channel is noisy.
I also keep one rule in mind. Baremetrics does not replace product analytics, and app store analytics does not replace revenue reporting. Each tool has a job. When I let them do separate work, I get better answers faster.
Conclusion
I still use app store analytics when I need acquisition data or store-level performance. I choose Baremetrics when I need the business story behind the store.
If I want MRR, ARR, churn, LTV, segmentation, and forecasting in one place, Baremetrics is the stronger app store analytics alternative. It gives me a clearer read on revenue health, not just platform activity.
When the question is “Are we growing profitably?”, I want the tool built for that answer.