

Baremetrics goal tracking only helps when the numbers behind it are clean. If the sync is off, the goal line looks tidy while the business story is muddy. I treat goals like a dashboard light, not a decoration. That means I set them up with care, check the source data first, and choose targets that
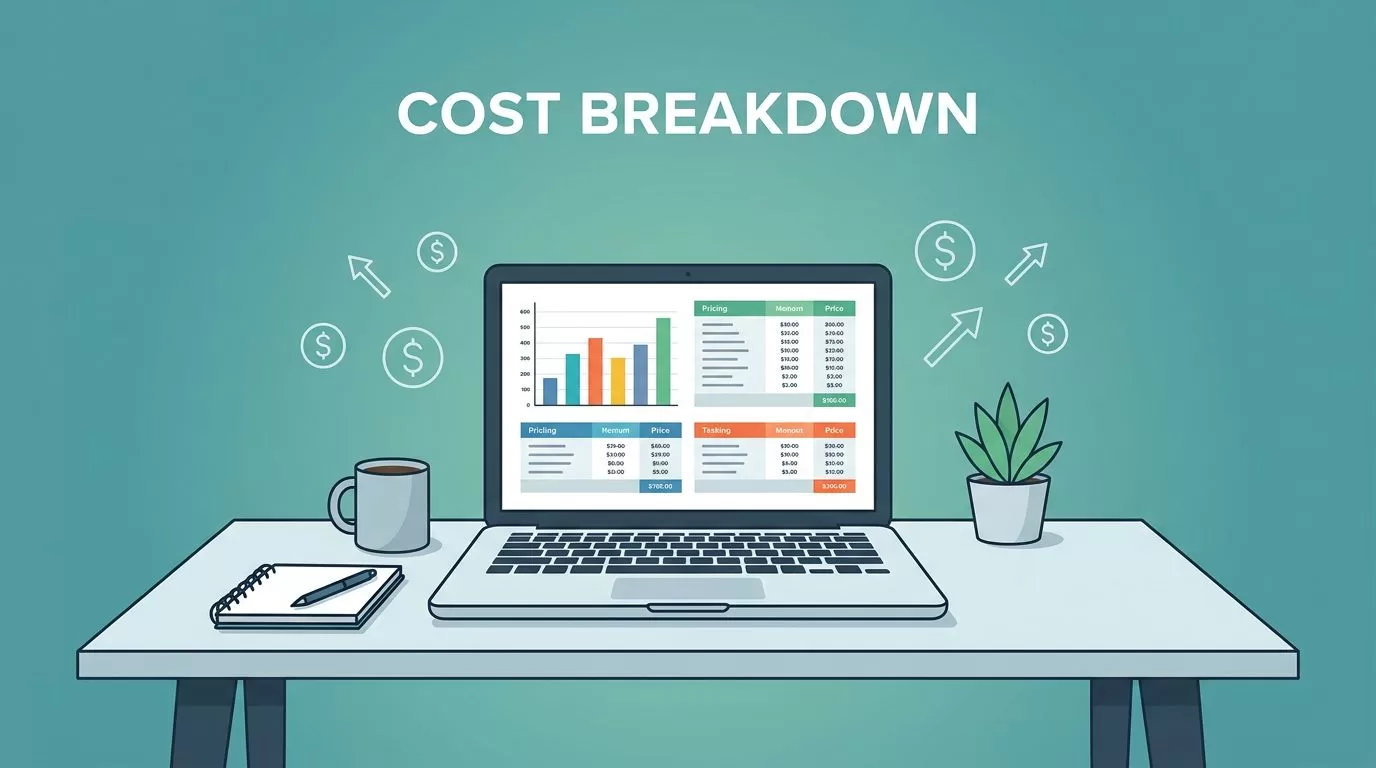
Baremetrics pricing in 2026 starts at $75 per month for Launch, $255 per month for Growth, and $1,152 per month for Scale. If I bill yearly, Baremetrics says the rate drops by 35%, so the real cost changes fast once I leave the monthly headline behind. That is why I never look at the sticker

When I compare Baremetrics vs ChartMogul in 2026, I do not see two copies of the same product. I see two different jobs. Baremetrics is the one I reach for when I want action, while ChartMogul is the one I reach for when I want cleaner reporting and more billing flexibility. That split matters because
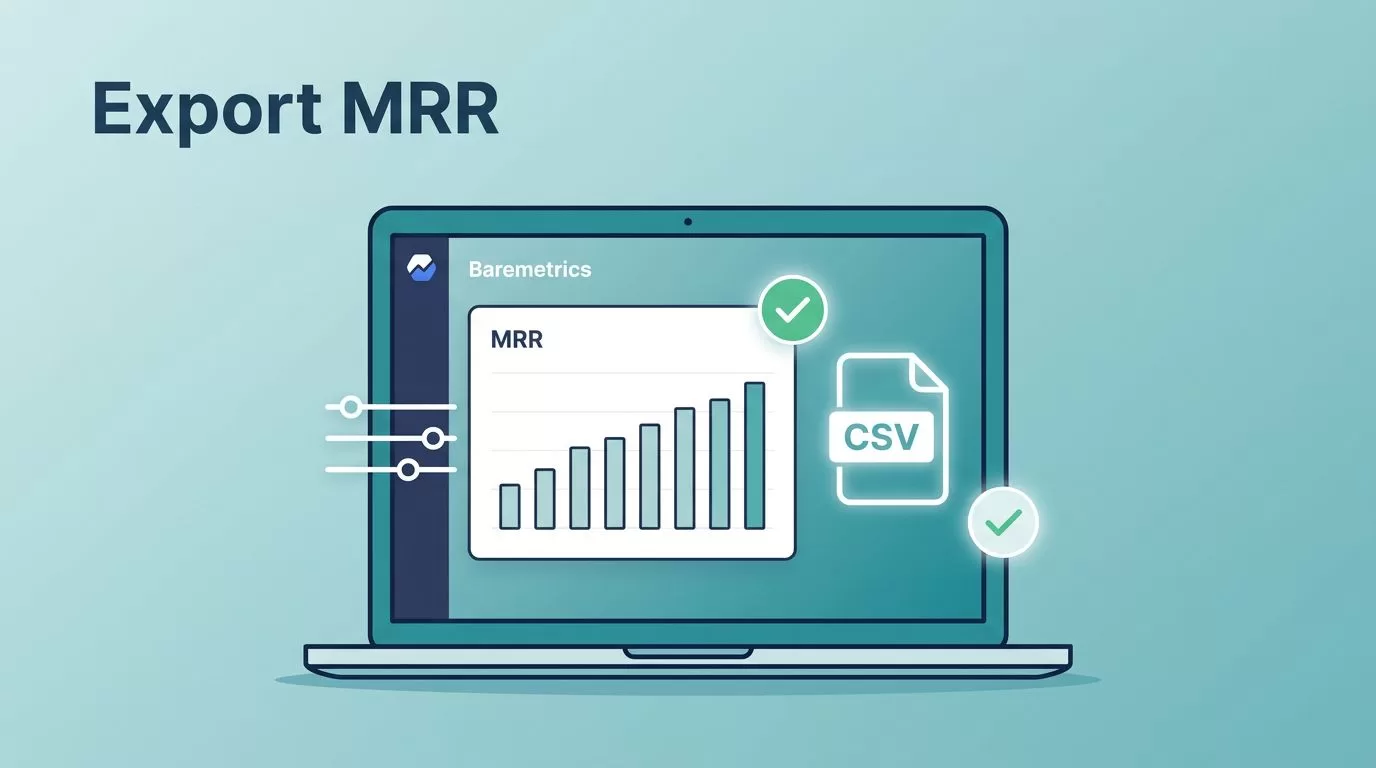
MRR reports can look simple until a filter is off by one month. Then the whole story shifts. When I need to explain revenue to a founder, finance lead, or investor, I want more than a screenshot. I want a CSV I can sort, check, and trust. That is where exporting MRR data from Baremetrics
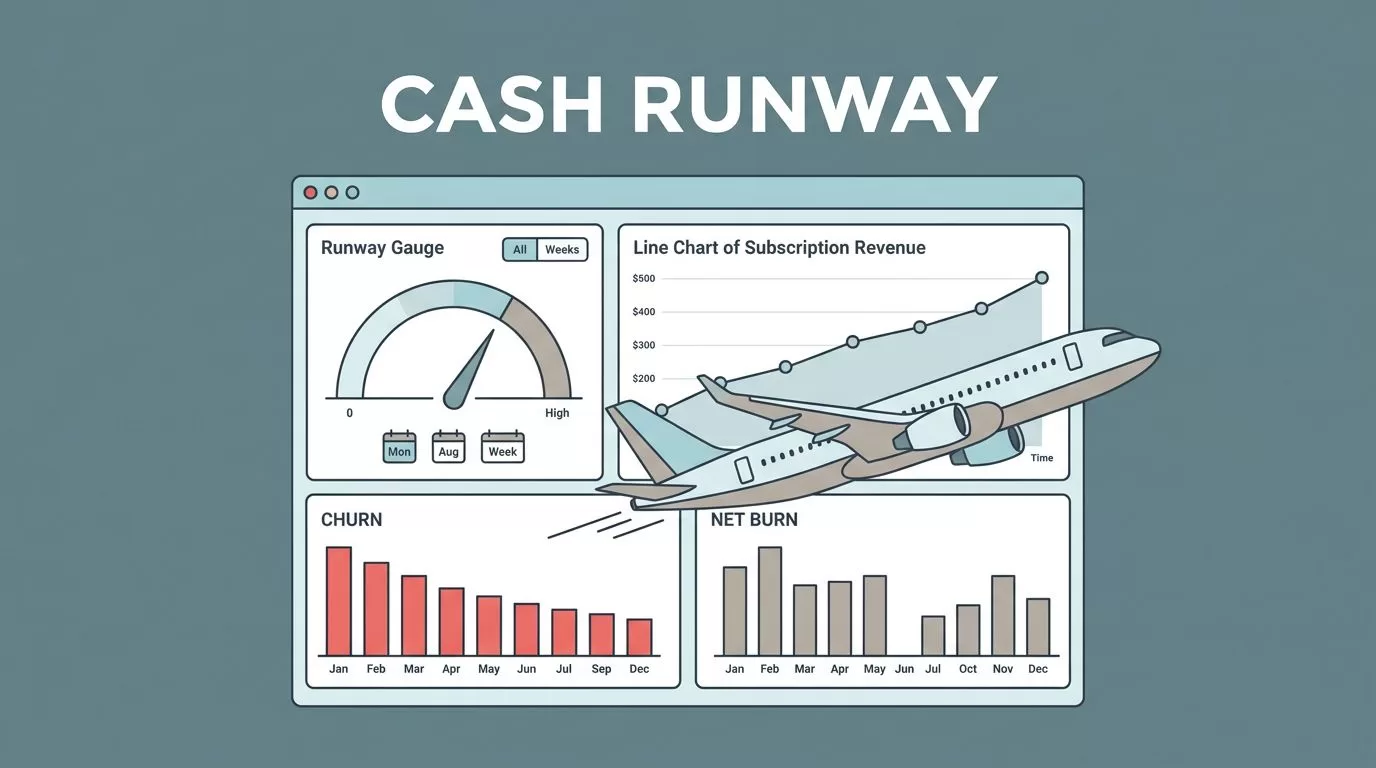
Cash can look fine until the month it doesn’t. A healthy bank balance can hide a slow burn, and a busy sales pipeline can hide weak retention. That is why I use a saas runway calculator when I want a clear answer, not a hopeful one. Baremetrics helps me read that answer in the context
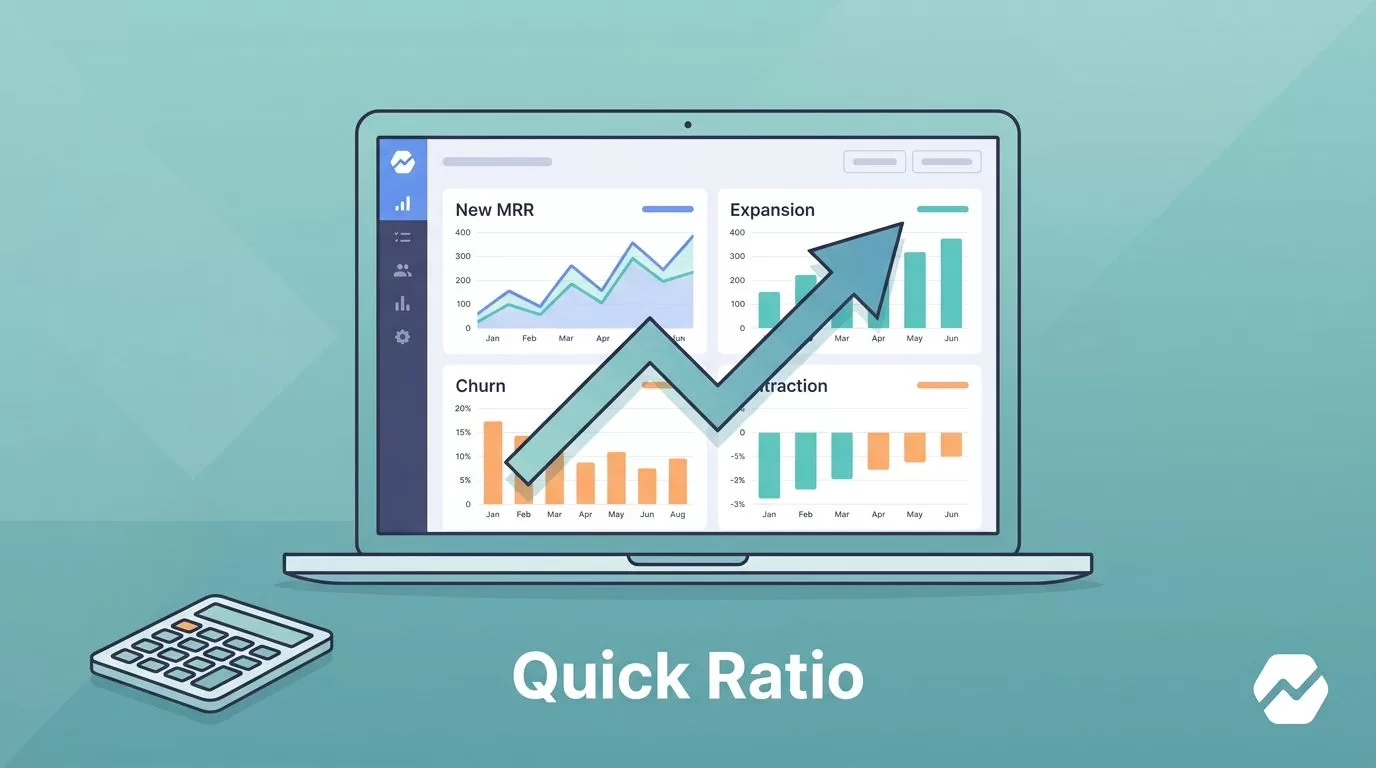
When recurring revenue starts to wobble, I want one number that tells me whether growth is outrunning loss. The SaaS quick ratio gives me that read, and Baremetrics gives me the pieces to build it. I use it when I need a clean view of new revenue, expansion, churn, and downgrades. If the ratio drops,
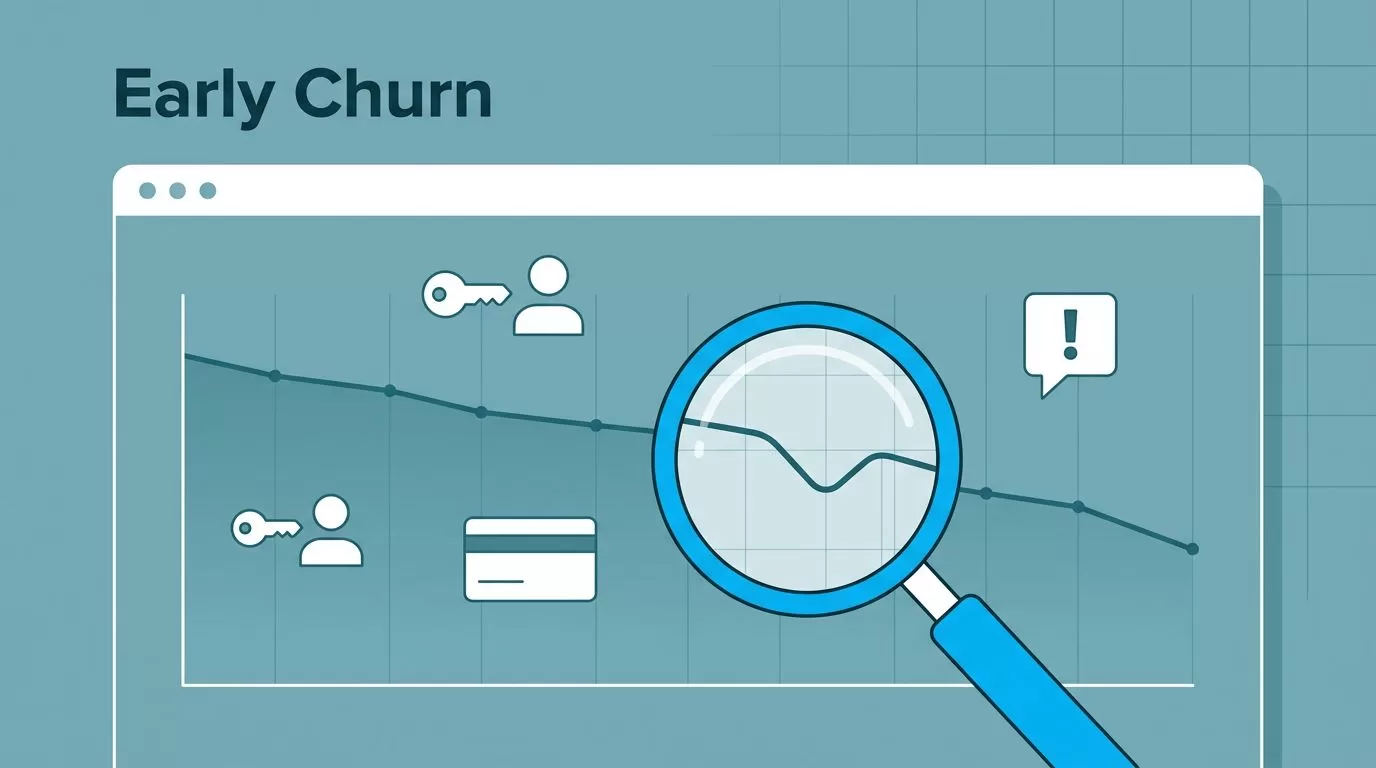
Churn rarely begins with a clean cancellation. It starts with a dropped login, a failed card, or a customer who stops using the product they once pushed hard to buy. When I look at Baremetrics churn data, I am not hunting for a dramatic red alert. I am looking for small shifts that tell me
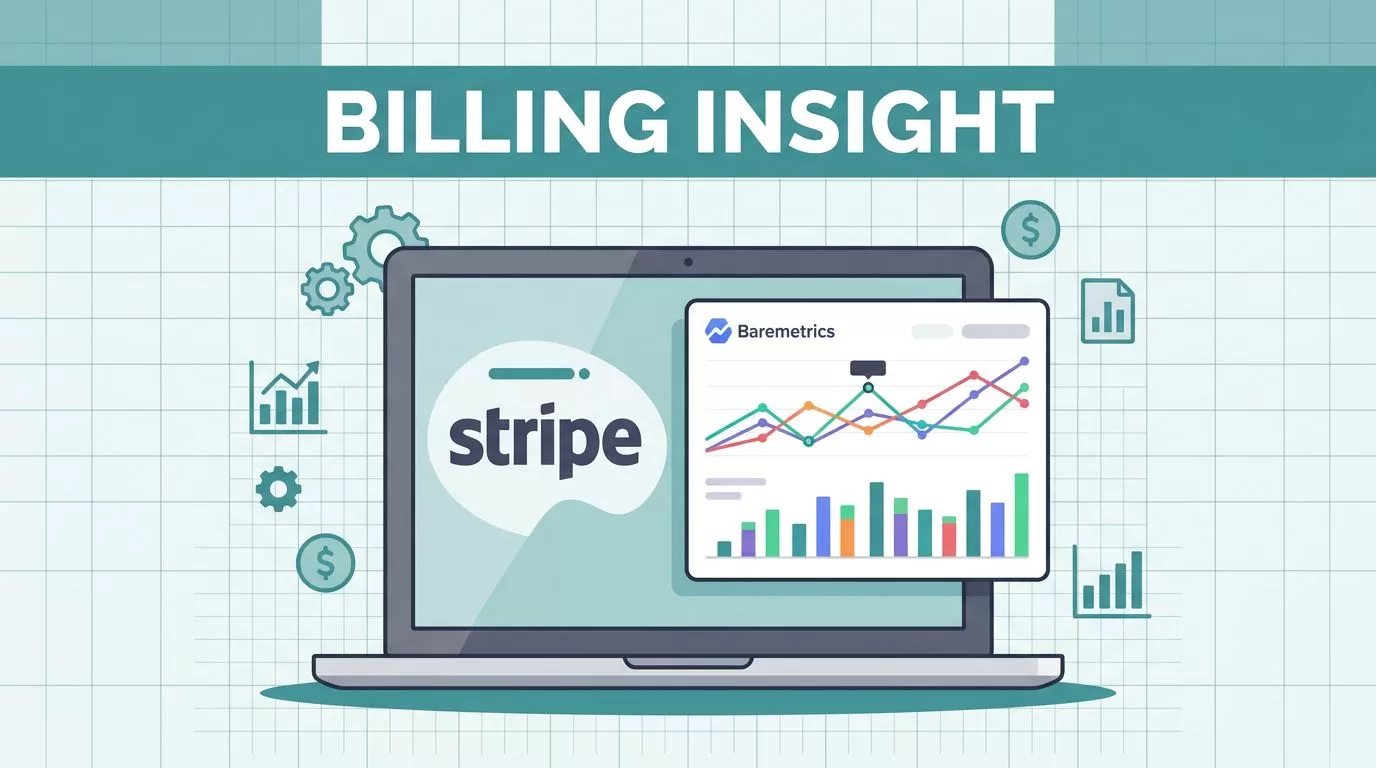
Stripe keeps the money moving, but it can still leave me staring at a pile of numbers. Baremetrics turns that pile into a view I can use for revenue, churn, and customer health. When billing data is messy, every forecast gets shaky. A spike in refunds can look like growth for a day, then turn
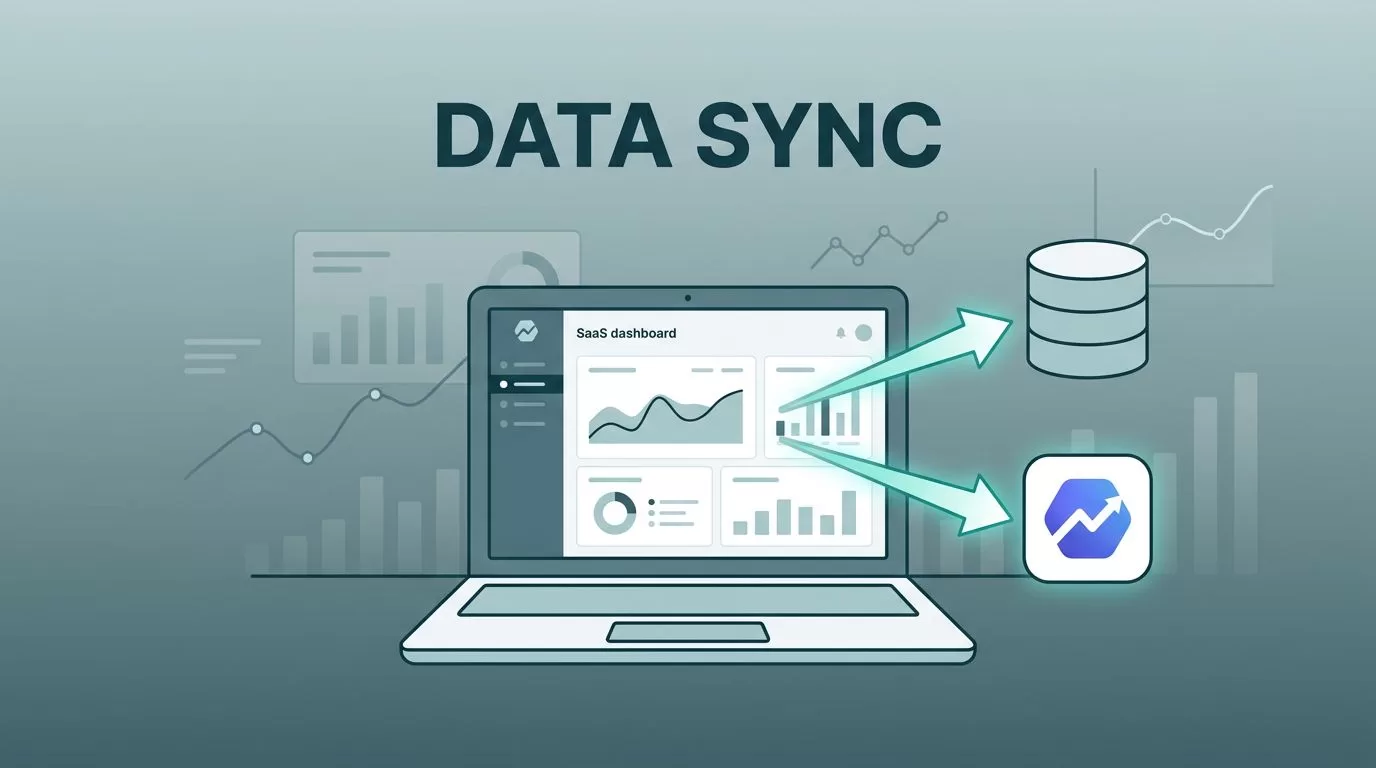
A subscription dashboard is helpful until finance, product, and data all ask different questions about the same customer. That is when I push Baremetrics into a warehouse and stop depending on exports and one-off spreadsheets. A Baremetrics data warehouse sync gives me one place to join revenue, customer, and product data. It also keeps recurring
