
Recurring revenue can look steady on the surface, then crack underneath like thin ice. That’s why I treat a Baremetrics analytics platform as an operating system for subscription decisions, not a pretty dashboard.
When I launch Baremetrics, I want three things fast: clean visibility into subscription performance, early warnings on churn, and a better read on expansion revenue. If those signals are clear, founders move faster, operators stop guessing, and revenue teams stop arguing over whose spreadsheet is right.
I start with billing truth, not dashboard vanity
The first mistake I see is chasing charts before fixing inputs. Baremetrics works best when my billing data is already clean, consistent, and connected to the right source. In most cases, that starts with Stripe. If I run multiple entities, custom invoices, or unusual billing logic, I slow down and map that first.
As of March 2026, Baremetrics still leans on modular, MRR-based pricing. Recent pricing summaries, including GetApp’s Baremetrics pricing page, show the same general structure: I buy the pieces I need, rather than one giant suite. Current public references also suggest the core Metrics module starts around $129 per month for businesses up to $10K in MRR, while Recover starts around $69 per month. Some sources also mention small-team launch pricing or a free entry tier, so I always double-check current terms before rolling it out.
Here’s the simple way I frame the core modules:
| Module | What I use it to answer | Business outcome |
|---|---|---|
| Metrics | Are MRR, churn, LTV, and cohorts moving the right way? | Faster weekly decisions |
| Recover | How much revenue is stuck in failed payments? | Lower involuntary churn |
| Cancellation Insights | Why are customers leaving? | Better retention fixes |

I also set owners before launch. Finance owns revenue definitions. Customer success owns churn follow-up. Growth owns expansion plays. Without that, a dashboard becomes wall art.
I use Baremetrics to catch leaks and spot growth pockets
Once data is live, the real work starts. I don’t stare at MRR alone. I look at the movement underneath it, upgrades, downgrades, cancellations, failed payments, reactivations, and segment-level changes by plan or customer type.
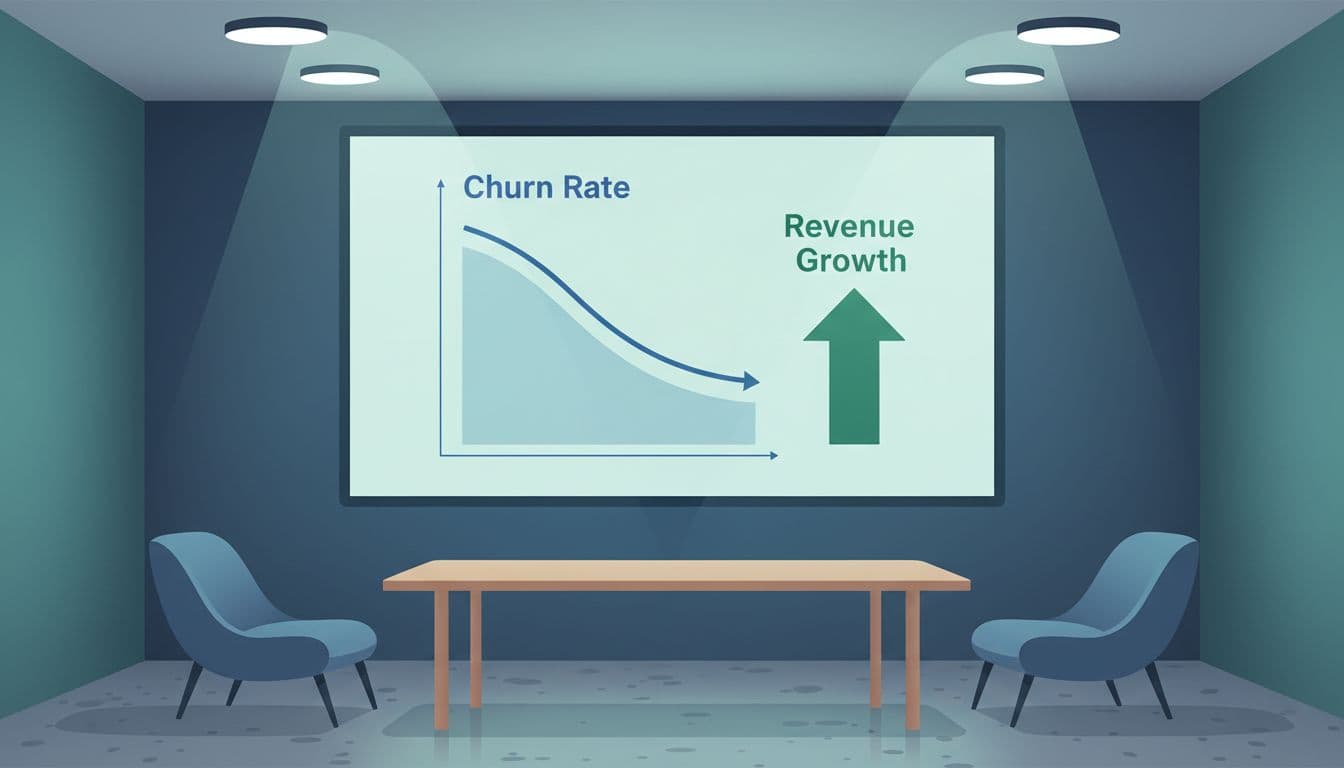
That matters because churn has two faces. One is loud, a customer cancels. The other is quiet, a card fails and the renewal never lands. Baremetrics helps me see both. When I pair Metrics with Recover, I can separate product churn from payment churn, which changes the fix. A save offer won’t help a broken card. A dunning flow won’t fix a weak onboarding experience.
If a metric doesn’t trigger an action, I don’t keep it on the main dashboard.
For expansion revenue, I watch customer profiles and plan movement closely. If higher-value accounts upgrade after hitting usage limits, I know where product value is strongest. If mid-market teams downgrade after month two, I know where onboarding or packaging breaks. Forecast tools also help, but only when the inputs are honest.
Here’s a simple use case I like. A founder reviews net new MRR each Monday. The CS lead checks cancellation reasons and failed-payment recovery each Wednesday. Then the growth lead watches upgrade patterns by segment on Friday. That rhythm turns one platform into a weekly operating cadence.
I treat Baremetrics as the center of subscription analytics, not the whole stack
Baremetrics is strong when I need subscription finance clarity. It is not a full product analytics tool, and it isn’t a full BI warehouse either. If I want feature-level usage, funnel drop-off, or event analysis, I still need another layer. That’s why I evaluate it as the core of a subscription analytics stack, not the only tool in the room.
This matters even more for data quality. Baremetrics can only report on what my payment and billing systems send. Bad metadata, messy plan names, refund edge cases, backfilled migrations, and broken customer IDs will distort the story. I’ve seen teams blame the tool when the real issue was upstream data.
I also keep integration limits in mind. Current 2026 references suggest Stripe remains the main connection point, with broader support and imports improving on higher plans. Some public summaries, like this Baremetrics review from Putler, also point out the trade-off: Baremetrics is focused, but less flexible if I need multi-channel commerce reporting or deep custom modeling.
When I compare the market, I also like scanning a broader 2026 SaaS analytics tools roundup. It helps me see where Baremetrics wins, fast subscription insight, and where I may still need other tools.
Revenue data tells me what already happened. For planning, I pair it with outside demand signals, much like I do when spotting industry growth early.
My 30-day launch plan for Baremetrics
I don’t try to boil the ocean in week one. I launch in layers.
- Connect the primary billing source. I start with the cleanest, most trusted subscription data source, usually Stripe.
- Lock metric definitions. I align finance, ops, and GTM on churn, reactivation, expansion, and net revenue terms.
- Build one executive view. I keep it tight: MRR, net new MRR, churn, failed payments, LTV, and upgrades.
- Add action loops. I route failed-payment recovery to revenue ops, cancellation reasons to CS, and upgrade trends to product and growth.
- Review data exceptions weekly. Refunds, coupon changes, migrations, and plan mapping errors can quietly poison reporting.
By day 30, I don’t need perfection. I need trust. Once the team trusts the numbers, adoption follows.
A subscription business can’t steer with fogged glass. When I launch Baremetrics well, I get a clearer map of revenue health, churn risk, and expansion room. Start with clean billing data, give each metric an owner, and keep the stack honest about its limits. The best Baremetrics analytics platform is the one that helps me act before revenue slips away.


