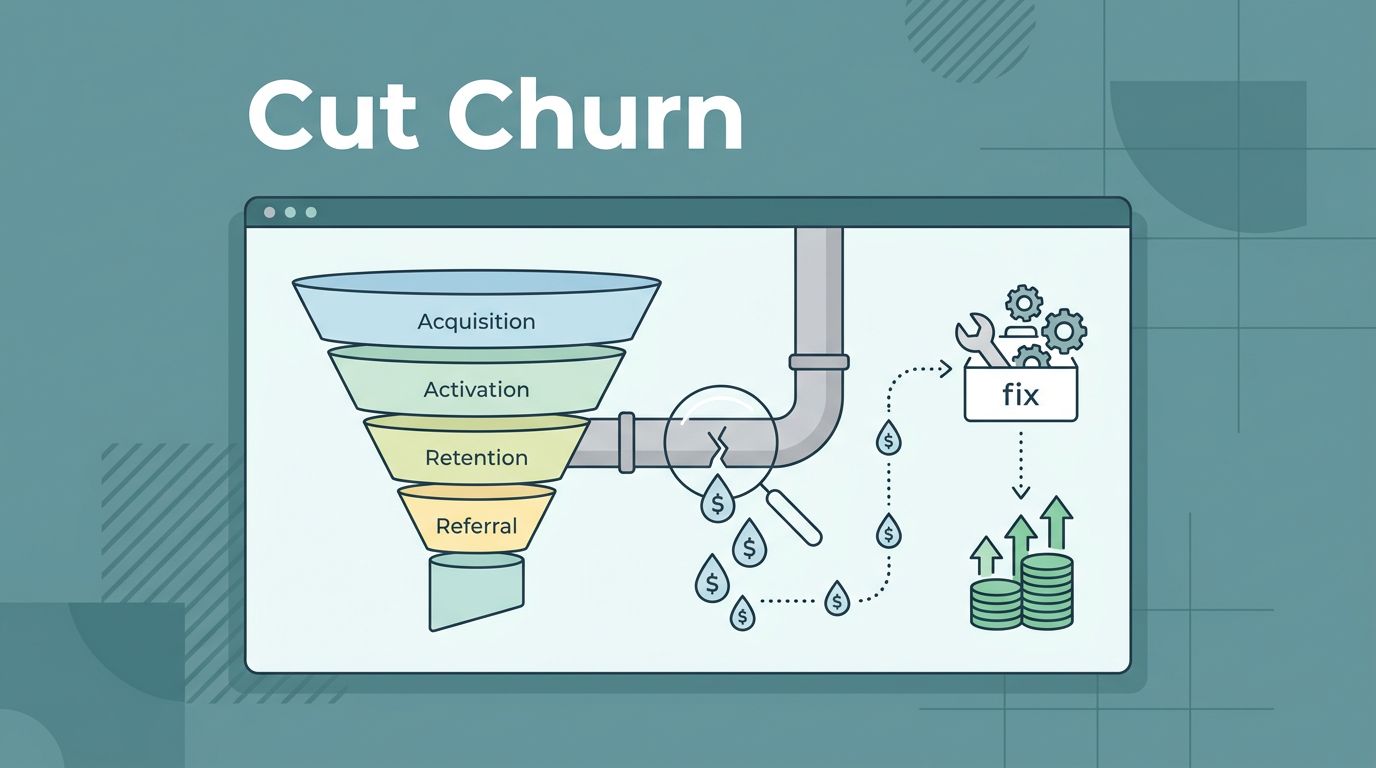
A churn chart tells me I have a leak. Baremetrics cancellation insights tells me where the pipe cracked.
When a subscriber leaves, I don’t want a shrug and a lower MRR line. I want the reason, the customer segment, and the money tied to that exit. That’s how I stop guessing and start fixing the right thing.
What Baremetrics cancellation insights actually gives me
As of March 2026, Baremetrics offers Cancellation Insights as a paid add-on for subscription teams. I can collect reasons in the cancel flow, or send a follow-up email after the user leaves. Baremetrics outlines both options in its setup guide for Cancellation Insights.
That timing matters because the message changes with the moment. In-app responses catch the raw reason. Follow-up emails often bring calmer, fuller comments. I like having both, because short labels alone can blur the truth.
Baremetrics also lets me customize the reasons, the form, and the follow-up. On the Cancellation Insights feature page, the core promise is simple: find out why people cancel, then act on it. For a SaaS team, that means I can match the reason list to my plans, product gaps, and pricing model instead of forcing every exit into a generic bucket.
The part I value most is revenue context. I’m not only counting reasons. I’m looking at lost MRR by reason. That keeps me from chasing the loudest complaint when the real damage sits somewhere else.
A dozen small accounts saying “too expensive” may matter less than two bigger customers saying “security needs” or “missing feature.” Baremetrics turns that difference into something I can see.
I also keep voluntary churn separate from failed payments. That’s a big line in the sand. Baremetrics explains the difference between Recover and Cancellation Insights, and I treat that split as my first filter before I make any product or pricing call.
How I read the reports without fooling myself
Once the data starts flowing, I avoid reading the report like a popularity contest. Reason counts matter, but revenue matters more.
If “too expensive” appears 30 times on a starter plan, while “missing compliance” appears three times on a high-value plan, those signals are not equal. I read both, but I don’t rank them the same.

Next, I segment before I act. I look at plan tier, customer age, signup cohort, and sometimes region if the sample is large enough. I also compare new subscribers with reactivated ones, because they often churn for different reasons. Baremetrics’ broader churn analysis guide is helpful here, since cancellation reasons mean more when I place them beside churn rate, LTV, and cohort trends.
This is the quick lens I use in weekly review:
| Reason trend | What I check next | Action I take |
|---|---|---|
| Too expensive on higher tiers | recent packaging, discount expiry, usage depth | test downgrade path or value messaging |
| Missing features from new accounts | onboarding completion, sales promise, setup friction | fix handoff or patch the gap |
| Switched to competitor from mature accounts | support history, reliability issues, roadmap fit | run interviews and targeted save outreach |
The table keeps me honest. Baremetrics cancellation insights becomes useful when I pair reason, segment, and MRR, not when I stare at a colorful chart.
If a reason spikes after a product or pricing change, I first compare the cohorts that saw that change. Otherwise, I can blame the wrong cause.
I also watch for false patterns. A bad month may contain two separate fires, failed payments on one side and true cancellations on the other. If I mix them, my next move will miss the mark.
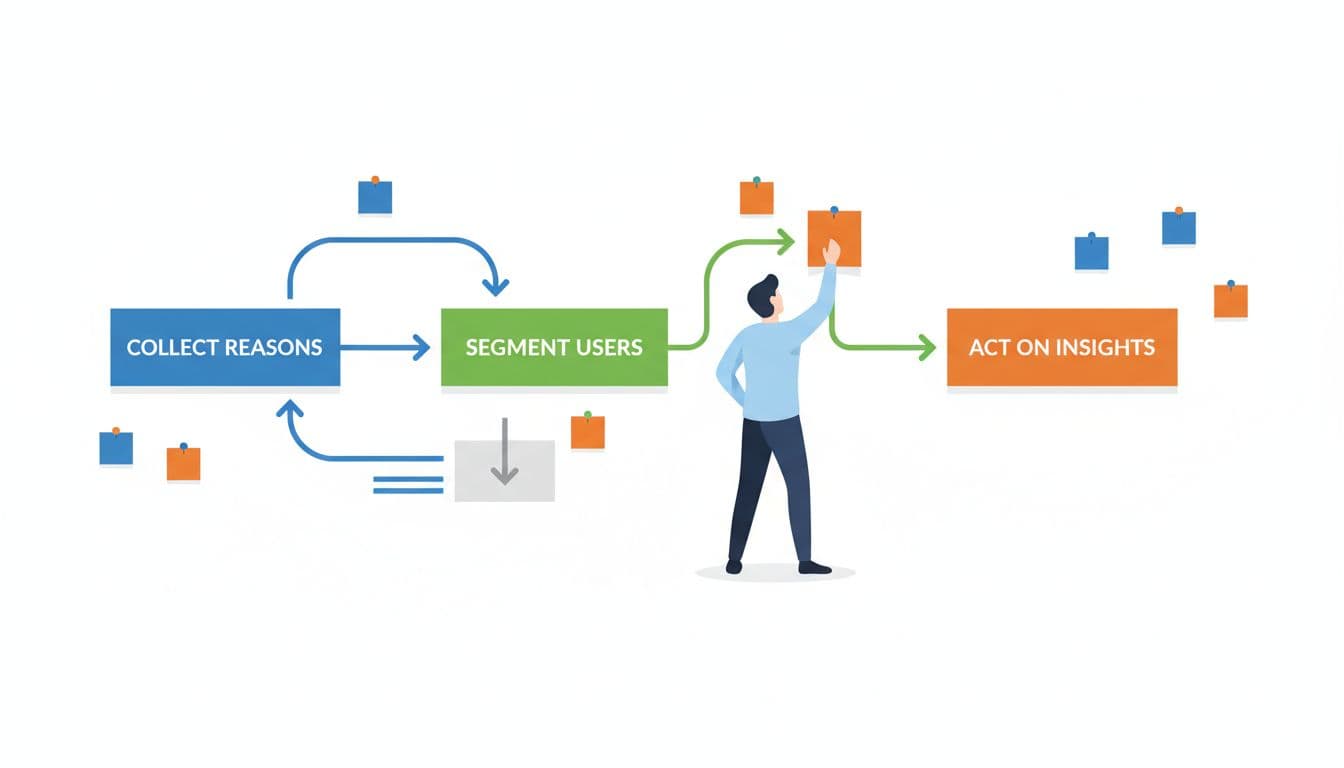
Build a weekly churn workflow that ends in action
Insight goes stale fast if nobody owns the next step. So I run a simple weekly loop, and I keep it close to product, support, and growth.
- Clean the reason set: I merge duplicates, trim vague labels, and keep one “other” option for comments. Too many choices turns the data muddy.
- Review lost MRR by segment: I scan plan level, tenure, and reactivated versus new customers. Then I ask one hard question, “Where is the most expensive churn pattern?”
- Trigger follow-up by reason: Baremetrics supports reason-based follow-up and win-back flows through its Cancellation Insights tools. The Help Center collection is useful when I want to adjust emails or embed the collection form in my app. Price-sensitive users may get a downgrade path. Competitor switchers may get an interview invite. Feature-gap exits may go straight into product research.
- Measure the next cohort: I look for lower churn, more reactivations, and better MRR retention in the segment I targeted. If the number doesn’t move, I drop the story and test a new one.
I like this workflow because it turns churn into a product signal, not a postmortem. A wave of “missing features” exits may push roadmap work. A jump in “too expensive” after packaging changes may point to weak value framing, not a need for blanket discounts.
When I need more ideas after the report tells me where the pain sits, I use Baremetrics’ own advice on reducing SaaS churn as a second layer. First I find the pattern. Then I pick the response.
A cancellation reason is a small note left on the door. When I collect it inside Baremetrics, tie it to revenue, and read it by segment, that note becomes a map.
The next move is simple. Turn on capture, review lost MRR by reason every week, and act on one pattern at a time. Baremetrics cancellation insights pays off when I use it as a loop, not a report.