You know that sinking feeling when marketing dollars vanish without new subscribers? I felt it too, back when I chased vanity metrics instead of real costs. Customer acquisition cost, or CAC, shows the true price of each paying user. It keeps your SaaS spend honest.
Baremetrics pulls the numbers together fast. No more manual spreadsheets. I use it to spot wasteful channels and focus on what pays off. Let’s walk through how I do it.
What Customer Acquisition Cost Tells You
CAC measures every dollar spent to land one new customer. Think ads, salaries, tools, even agency fees. Divide that total by new signups in a month or quarter. The result guides your budget.
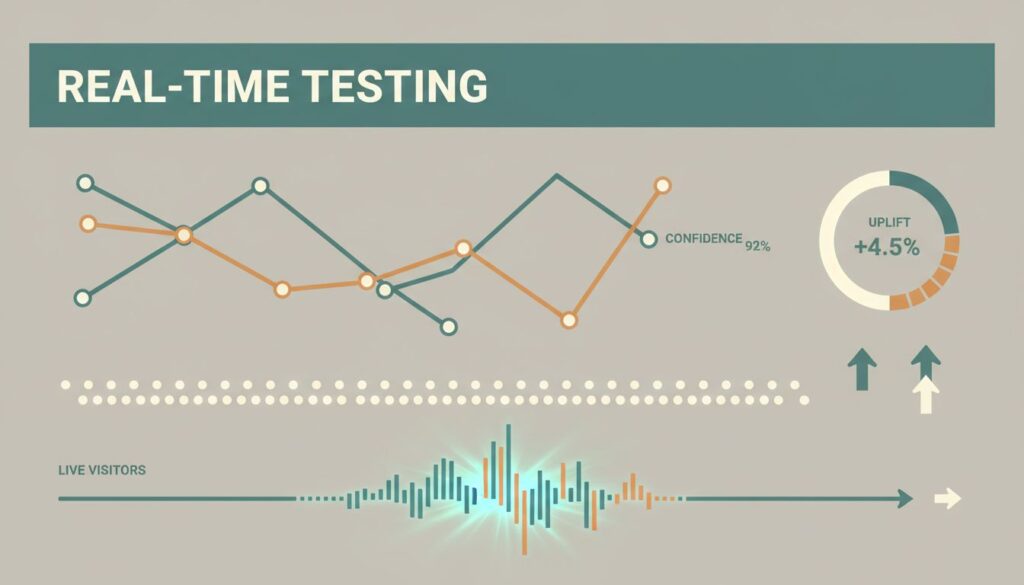
I check CAC monthly. High numbers signal trouble, like ads that attract one-timers. Low ones mean efficient growth. For SaaS, aim below your lifetime value.
Baremetrics shines here because it segments data by channel. Google Ads CAC at $150? Facebook at $80? You see it clear. That view saved me from dumping cash into underperformers.
The CAC Formula Explained
The math stays simple. CAC equals total acquisition costs divided by new customers. Costs include sales pay, marketing software, content creation, paid search. Count only net new paying users, not trials or leads.
Here’s a quick example. Say you spend $10,000 on ads and team salaries in May. You gain 100 new subscribers. CAC is $100 each. Track it over time to catch rises.

This formula works best over consistent periods. Match costs and customers to the same window. Baremetrics automates the customer count from Stripe or Chargebee. For details on their approach, check Baremetrics’ CAC guide.
Key Inputs for Solid CAC Numbers
You need clean data on two fronts: spend and customers.
First, tally sales and marketing expenses. Pull from QuickBooks or Google Sheets. Include salaries (prorate if needed), ad platforms like Google or Meta, tools like HubSpot. Skip overhead like office rent.
Second, count new customers. Baremetrics grabs this from your billing system. It filters paying users, ignores churn or upgrades.
I log spends weekly in Baremetrics. That keeps inputs fresh. Without it, you guess and inflate CAC.
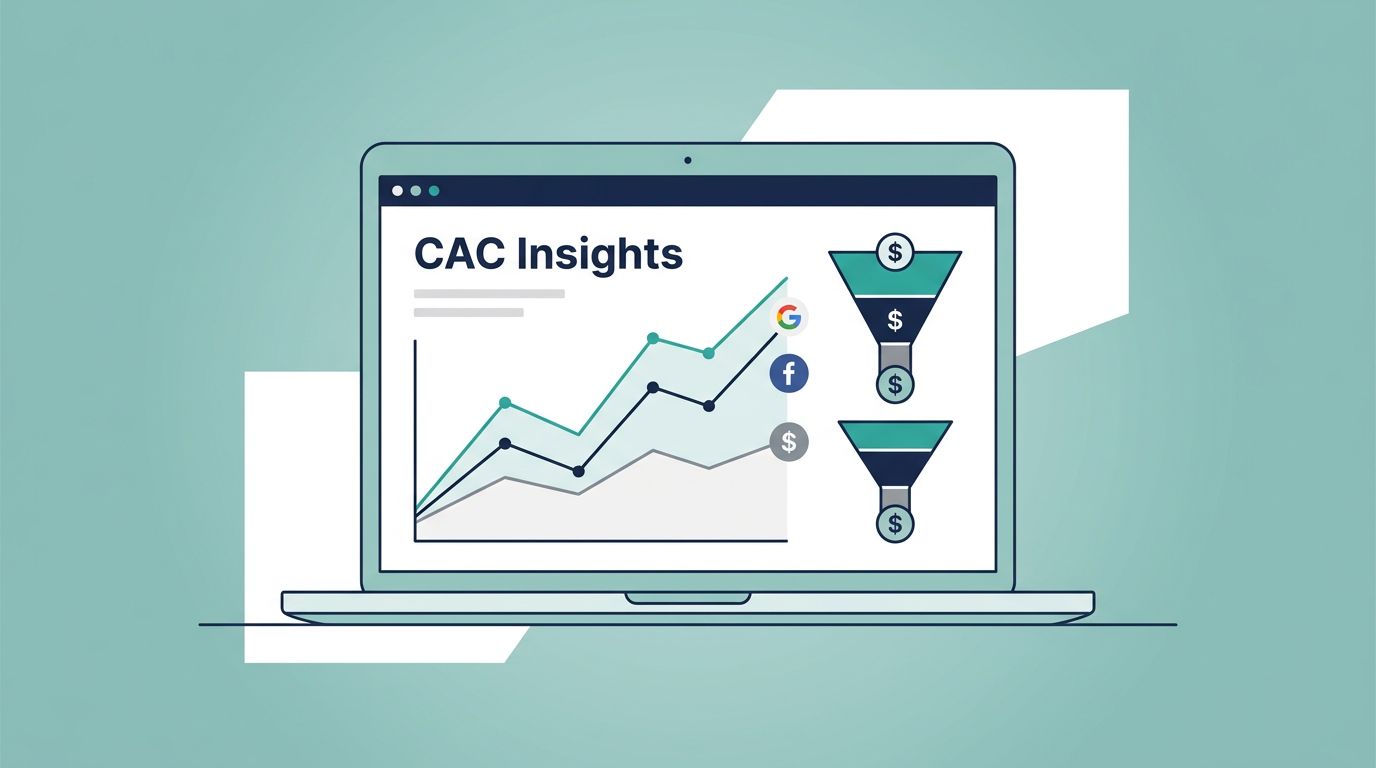
Why Baremetrics Simplifies CAC Tracking
Baremetrics connects to Stripe, Chargebee, Shopify. It auto-pulls new customer data. Add your spends manually or via integration. Boom, CAC appears on dashboards.
Real-time updates help too. See shifts as they happen. Segment by plan or geo for deeper views. I link it to my Baremetrics dashboard setup for one-screen oversight.
It calculates related metrics automatically. LTV to CAC ratio, payback time. All in one spot.
Step-by-Step: Calculate CAC in Baremetrics
I follow these steps each month. They take under 30 minutes.
Connect your billing first. Go to integrations, link Stripe or Recurly. Data flows in seconds.
Next, enter costs. In the CAC section, input ad spend, salaries, tools. Baremetrics totals them.
View new customers. Dashboards show monthly adds. Pick your period.
Hit calculate. CAC pops up, broken by channel.

For Stripe users, follow Baremetrics’ Stripe CAC steps. Test with last quarter’s data. Compare to manual calc.
Pitfalls That Skew Your CAC
Many trip on basics. Don’t exclude sales salaries; they count. Match time periods exactly, or CAC jumps.
Ignore free trials as customers. Only paying ones matter. Blended CAC mixes channels wrong.
I once forgot tool costs. CAC looked great until reality hit. Audit inputs quarterly.
Channels matter. A low CAC from junk traffic hurts long-term. Baremetrics flags this with retention data.
Link CAC to LTV and Payback Period
CAC alone misses the picture. Pair it with lifetime value (LTV). LTV divides average revenue by churn rate. Healthy ratio is 3:1. Spend $1, earn $3 back.
Payback period shows recovery time. Divide CAC by monthly revenue per customer times margin. Under 12 months works for most SaaS.
Baremetrics computes both. I watch the ratio drop below 3 and cut channels fast. Ties everything to revenue health. See my take on Baremetrics MRR accuracy for context.
Wrapping Up CAC Mastery
Mastering customer acquisition cost with Baremetrics sharpens your SaaS edge. You spot waste, prioritize channels, balance growth costs. Start small, track monthly, adjust.
The payoff comes quick. Lower CAC means more room for product or hires. Plug in today and watch numbers align. Your bottom line thanks you.
(Word count: 982)