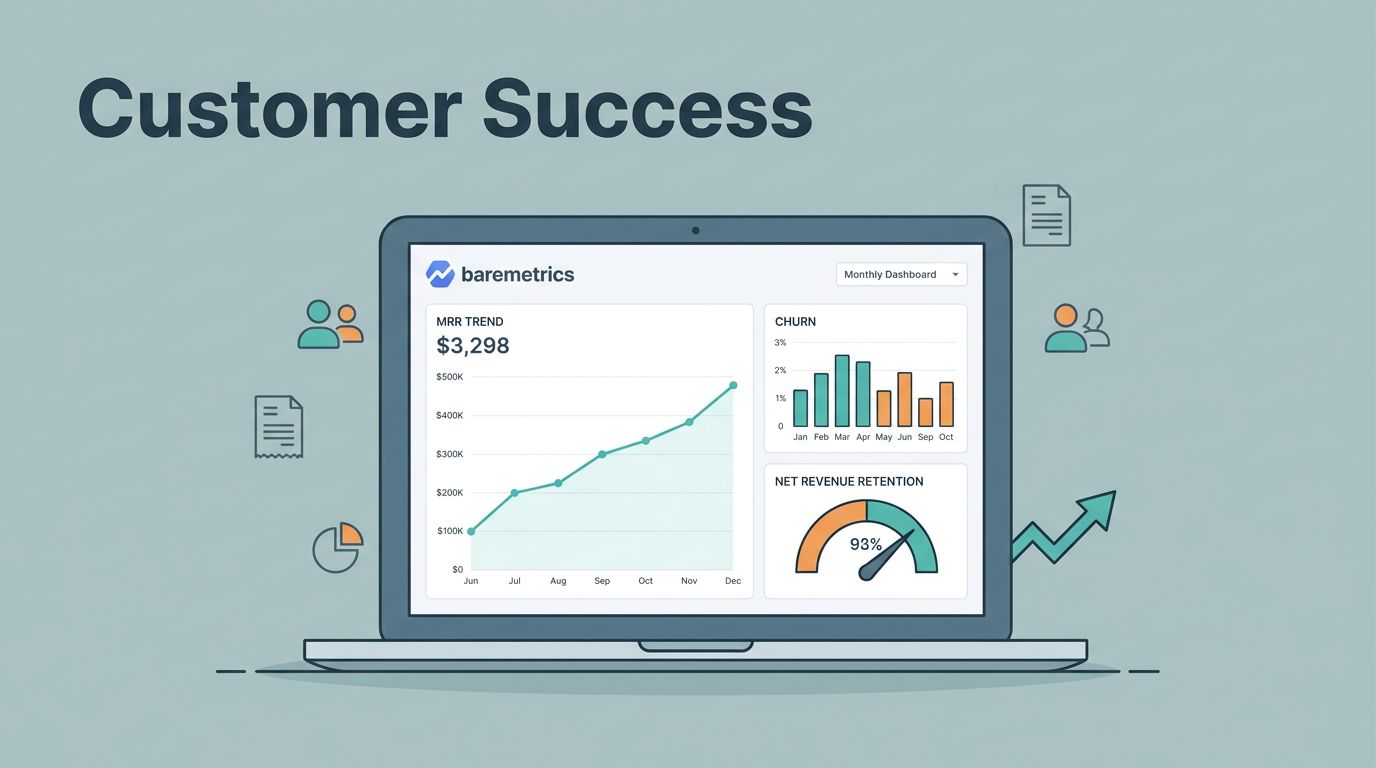

Churn rarely shows up with a warning label. It starts as a small dip in MRR, a weak cohort, or a few failed payments that look harmless on their own. I use Baremetrics customer success metrics to catch those signals early. When I read the numbers the right way, I can see which accounts are

A refund can make a revenue chart look smaller than it is, or cleaner than it should be. When I track Baremetrics refunds, I want one clean split between what changed in the billing system and what changed in the revenue story. If I mix refunds with cancellations or chargebacks, MRR gets noisy, churn looks
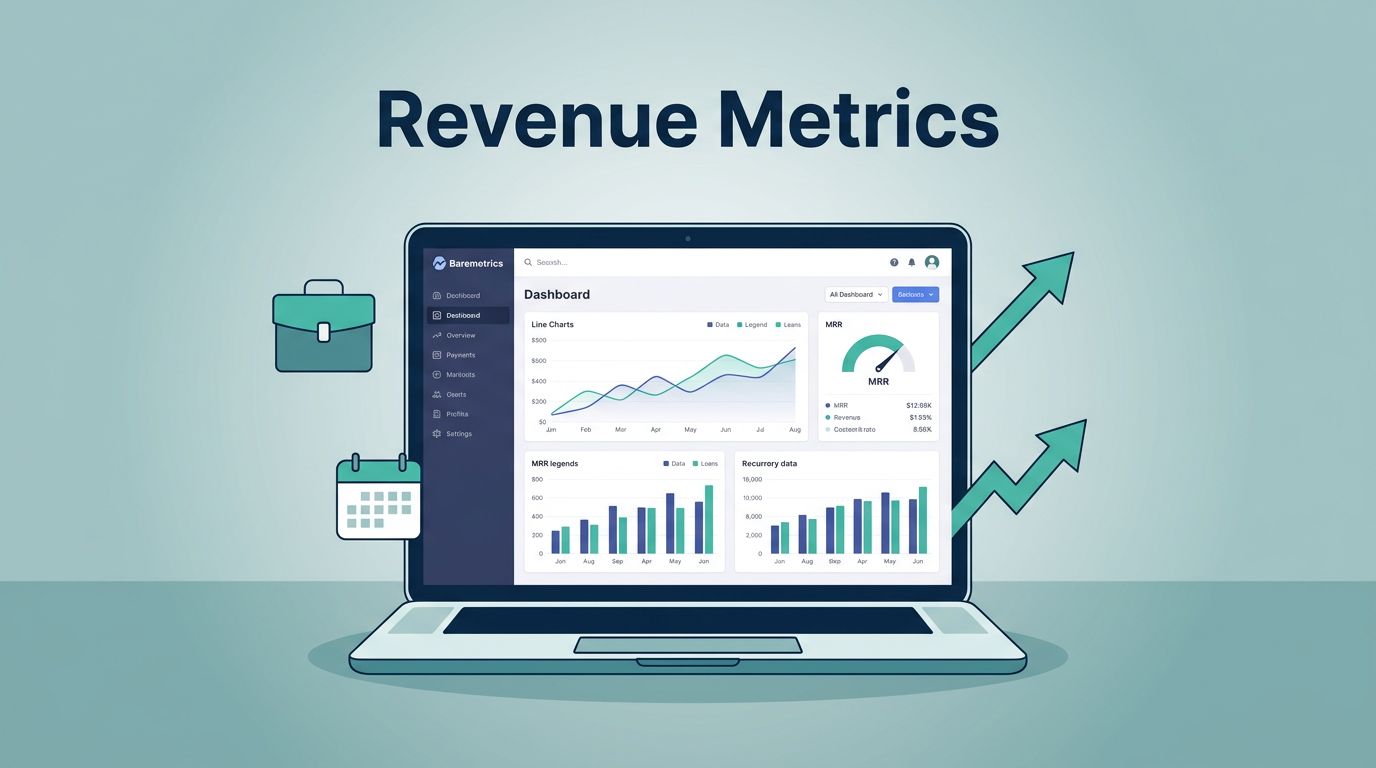
If your agency earns recurring retainers, one weak month can hide under a stack of invoices. I use Baremetrics subscription metrics to strip that noise down to a clear revenue picture, so I can see growth, leakage, and risk early. For agencies, that matters because the billing story is rarely the full story. A few
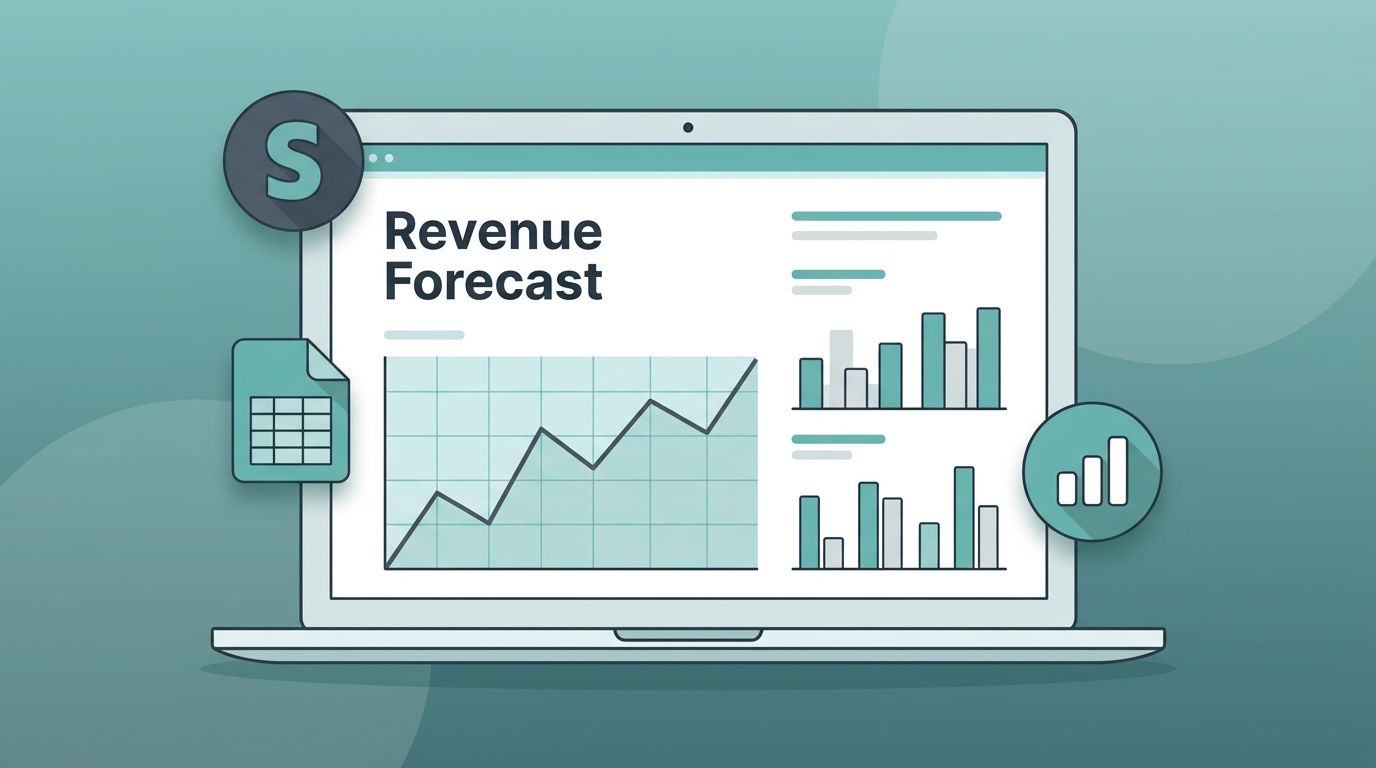
A forecast only matters if it survives the next billing cycle. That’s why I treat SaaS revenue forecasting as a working model, not a slide deck. Baremetrics gives me a clean view of recurring revenue, churn, and expansion. I still need assumptions, though, and sometimes I need spreadsheets or accounting data to close the gap
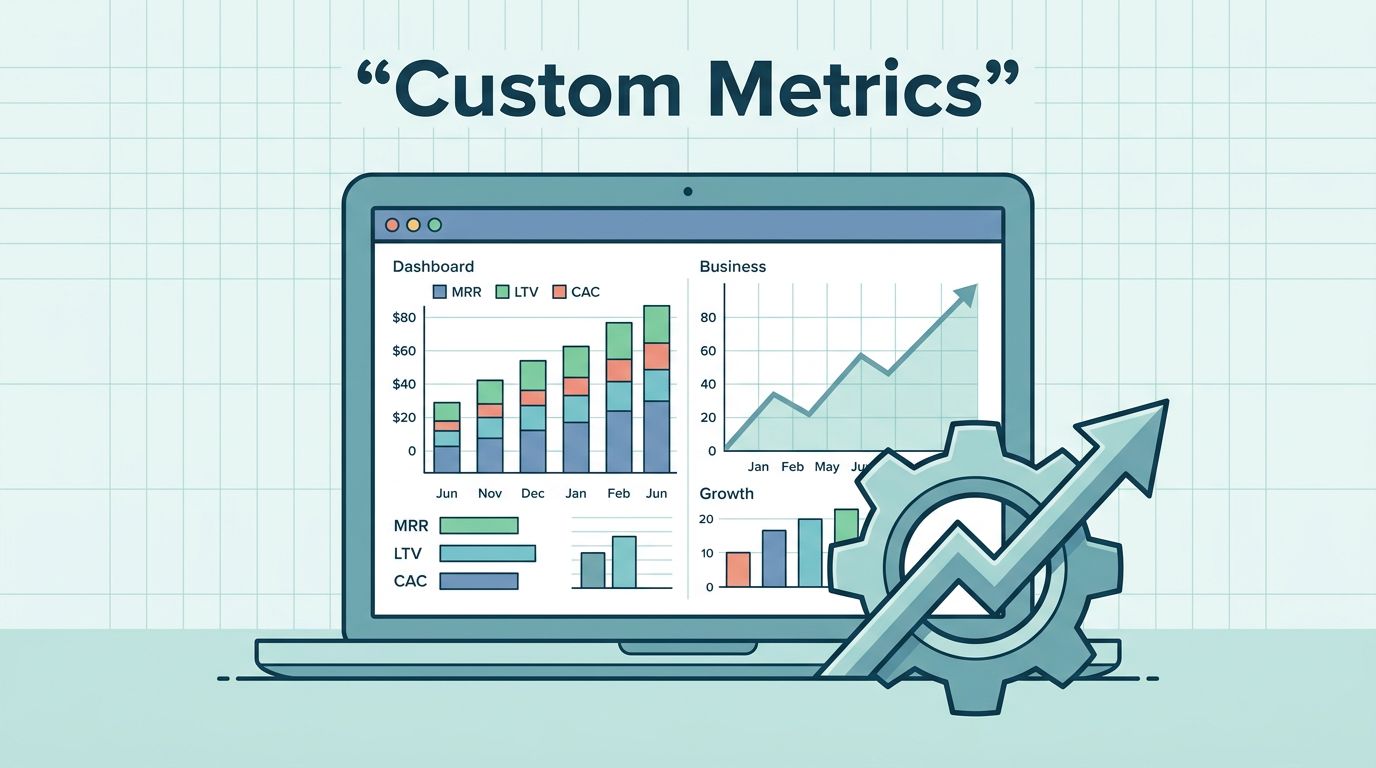
Some dashboards get noisier as a company grows. Baremetrics can show plenty of standard subscription numbers, but that does not mean the view is useful. I build custom metrics when I need one number that answers one business question. That usually means custom MRR breakdowns, expansion and contraction tracking, trial-to-paid performance, segmented LTV, or cohort

Failed payments rarely arrive with drama. They show up as a quiet dip in cash flow, then a messy follow-up thread, then a churned account that could have been saved. When I keep Baremetrics delinquent accounts under continuous watch, I catch those weak signals early. That matters when I need clean revenue numbers, fast recovery,
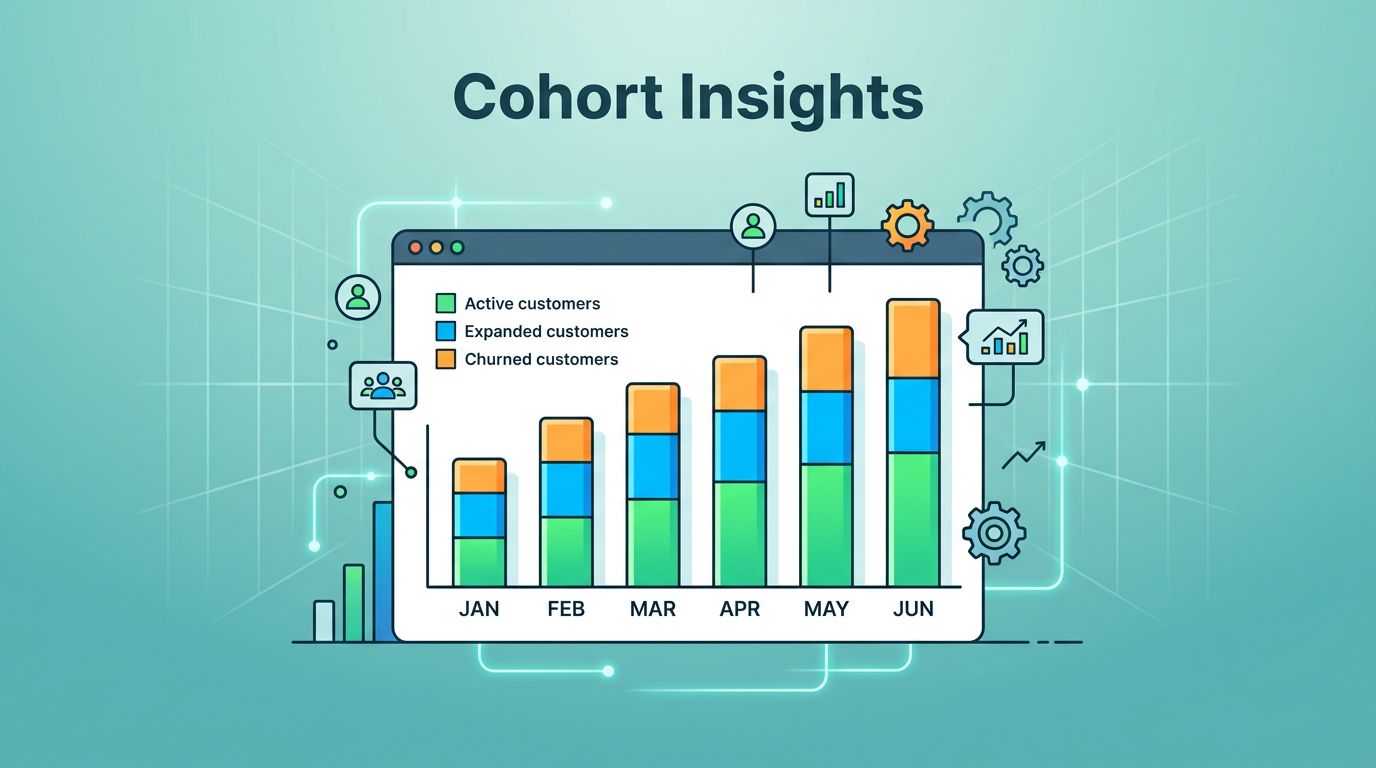
When revenue looks flat, I often find the reason in one cohort row. A single signup month can hide a lot, and Baremetrics signup cohorts make that month visible line by line. I use them to see whether customers who joined in the same month stay active, expand, or disappear. That view helps me separate
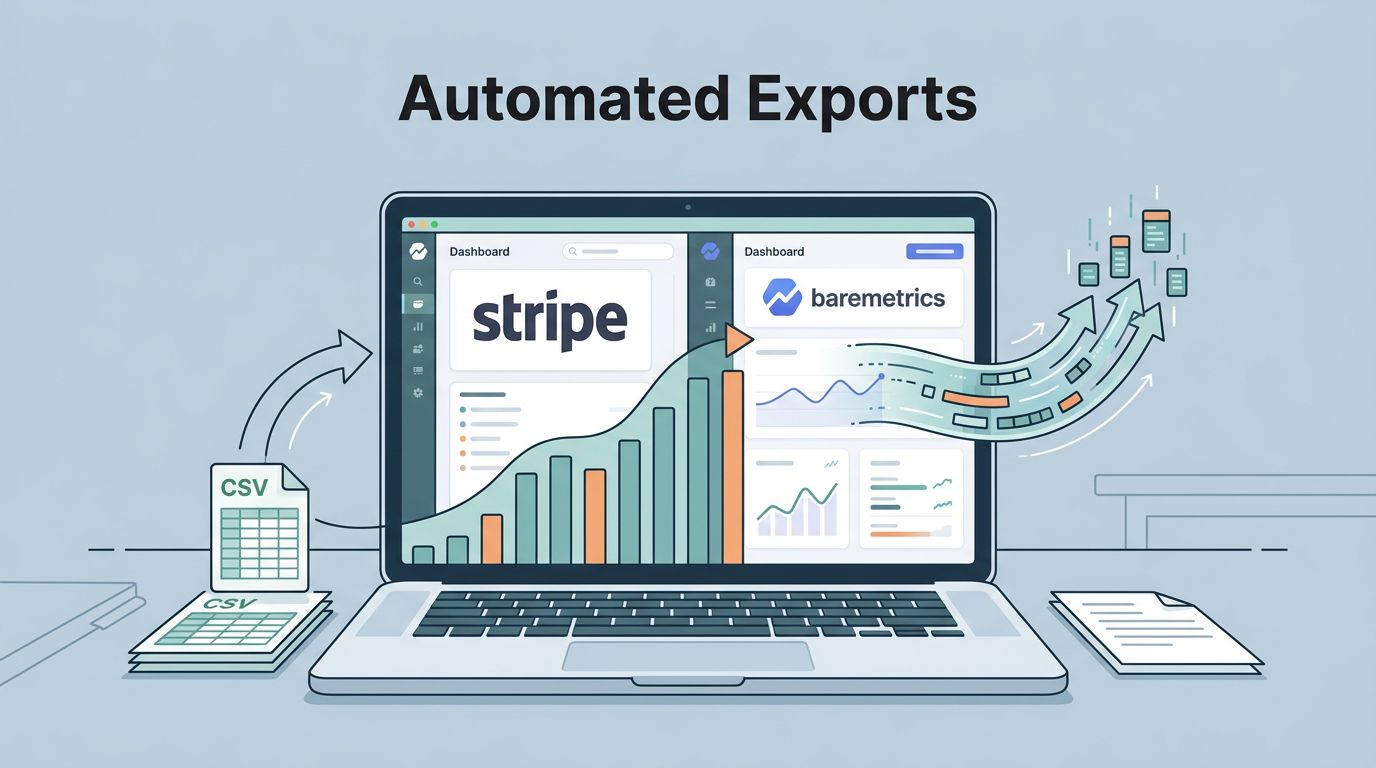
How many times can a team download the same CSV before the process starts stealing attention? When I work with subscription data, the hard part is rarely Stripe itself. The real drag comes from the repeat work around it, the exports, the cleanups, and the small errors that creep in before a board meeting or
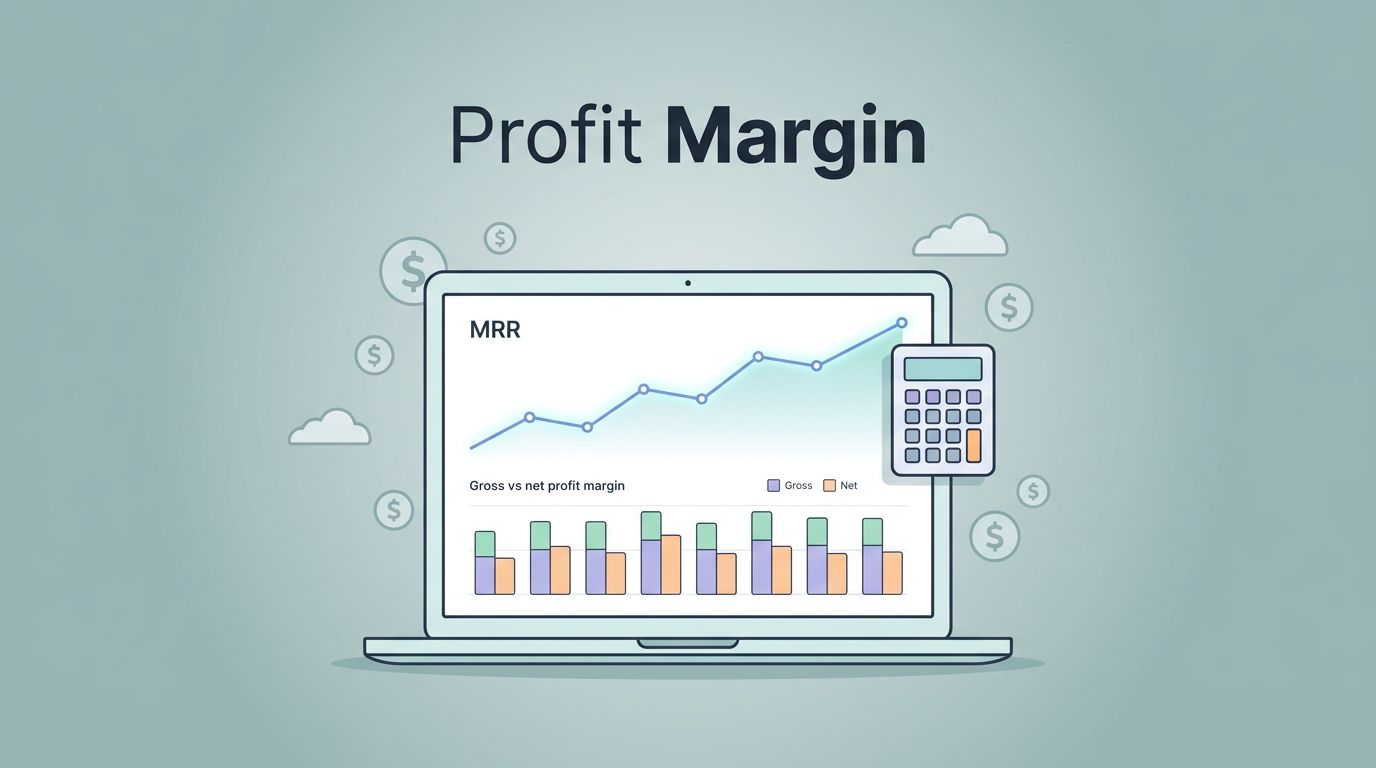
MRR can look healthy while profit slips through the cracks. I see that happen when revenue grows faster than cost control. To measure saas profit margin with Baremetrics, I start with revenue truth and then pair it with cost truth. Baremetrics helps me read the subscription story, while my accounting data tells me what survives
