How I Deploy a Customer Lifetime Value Calculator With Baremetrics
A customer lifetime value calculator turns one abstract idea into a number you can budget against. Customer lifetime value, often shortened to CLV or LTV, estimates the total revenue a customer brings over the full relationship. In SaaS, th...
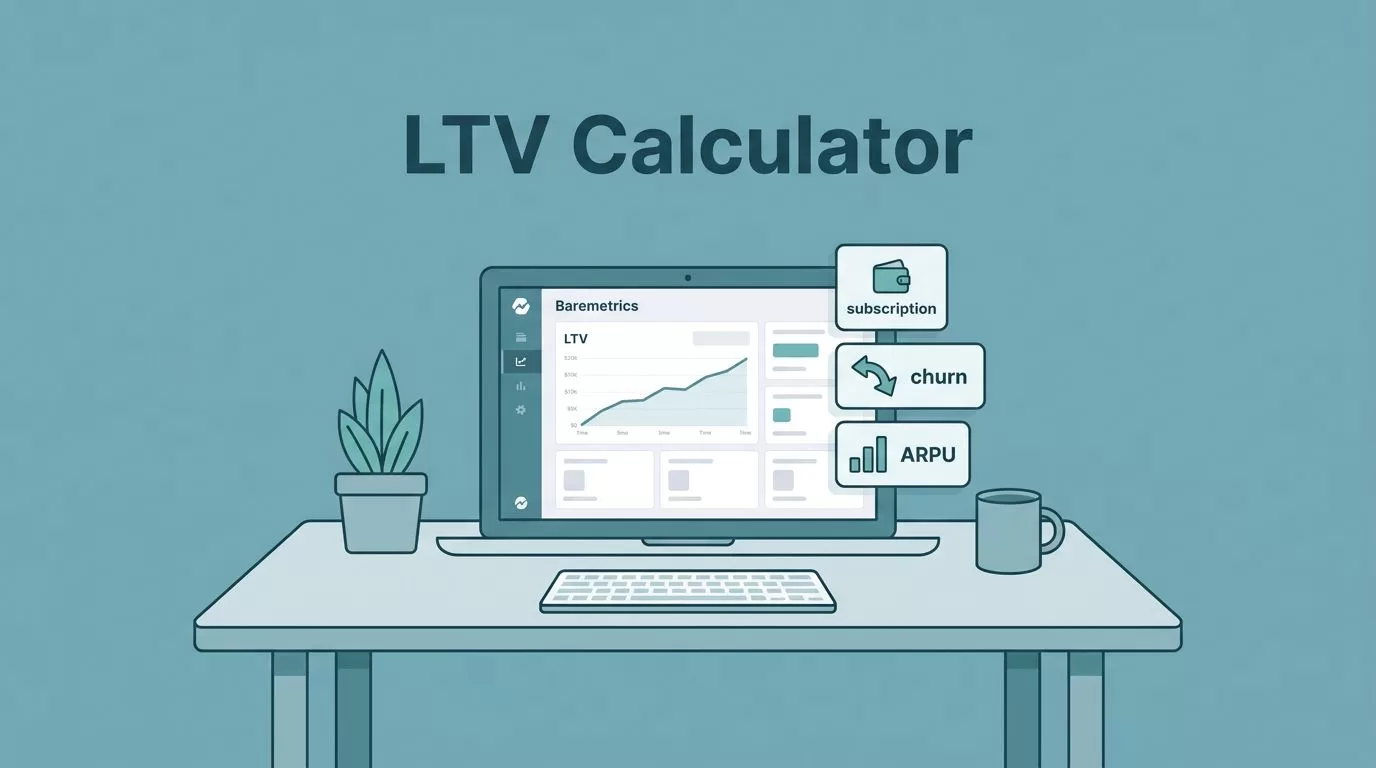
A customer lifetime value calculator turns one abstract idea into a number you can budget against. Customer lifetime value, often shortened to CLV or LTV, estimates the total revenue a customer brings over the full relationship. In SaaS, the figure shows whether pricing, churn and acquisition spend pull in the same direction.
Baremetrics calculates LTV from live subscription data and lets you split the result by segment. This guide explains the formulas, the setup steps in Baremetrics, the checks to run before you trust the output and the mistakes to avoid. Every formula below comes from the Baremetrics guide to calculating LTV.
What a Customer Lifetime Value Calculator Should Tell You
CLV answers a spending question. How much can you pay to win a customer and still earn a return? A reliable number sets limits for paid acquisition, sales hiring and retention projects.
In SaaS, CLV and LTV mean the same thing. Baremetrics uses the term LTV in its documentation. The figure depends on two inputs. ARPU shows the average revenue each customer brings per month. Churn shows how fast customers leave.
No single metric stands alone. Read CLV beside the neighboring numbers.
| Metric | What the metric shows | Why CLV needs the metric |
|---|---|---|
| CLV or LTV | Predicted revenue over the customer lifetime | Sets the acquisition spending limit |
| CAC | Cost to acquire one customer | Defines the payback pressure |
| MRR | Recurring revenue this month | Feeds the ARPU calculation |
| ARPU | Average monthly revenue per customer | Drives the size of the result |
| Churn | Share of customers who cancel in a period | Shrinks lifetime fast when high |
The Formulas Baremetrics Uses
Baremetrics states three versions of the calculation. Each version suits a different level of caution.
- Lifetime formula: LTV equals ARPU multiplied by customer lifetime. ARPU here means average monthly recurring revenue per user.
- Churn formula: LTV equals ARPU divided by user churn. Use the monthly churn rate as a decimal.
- Conservative variant: multiply the result by a discount rate of 0.75. Baremetrics writes the formula as ARPU times profit per user, divided by churn, times 0.75.
The guide gives simple examples. A customer who pays 100 dollars per month for 12 months produces an LTV of 1,200 dollars. Applying the 0.75 discount to this figure gives 900 dollars. The guide also defines a 5% churn rate as losing 5 of 100 subscribers in a period.
Here is a worked example with the churn formula. Assume ARPU of 100 dollars and monthly churn of 5%. Divide 100 by 0.05. The result is 2,000 dollars. Now assume an 80% gross margin. Profit-based value falls to about 1,600 dollars. Use the profit-based figure when you compare LTV against acquisition cost, because revenue alone ignores the cost of serving the customer.
Baremetrics also hosts a free LTV calculator for quick checks. For an outside view on the formula, read a CLV formula guide from KISSmetrics.
How to Calculate ARPU Correctly
ARPU drives the whole calculation, so errors here spread everywhere. The Baremetrics help article defines ARPU as MRR divided by active customers. The Baremetrics academy example divides 3,459 dollars of MRR by 146 customers to reach 23.69 dollars.
Follow three rules. Exclude free and trial users, because they pay nothing. Use the monthly figure, because the churn formula expects a monthly rate. Account for upgrades, downgrades and cancellations in the same month. Read the Baremetrics ARPU help article for the full definition.
Watch one trap in the Baremetrics LTV guide. An example in the article labels ARPU as yearly, while the formula defines ARPU as monthly. Always check the time unit before you divide.
How to Set Up LTV Tracking in Baremetrics
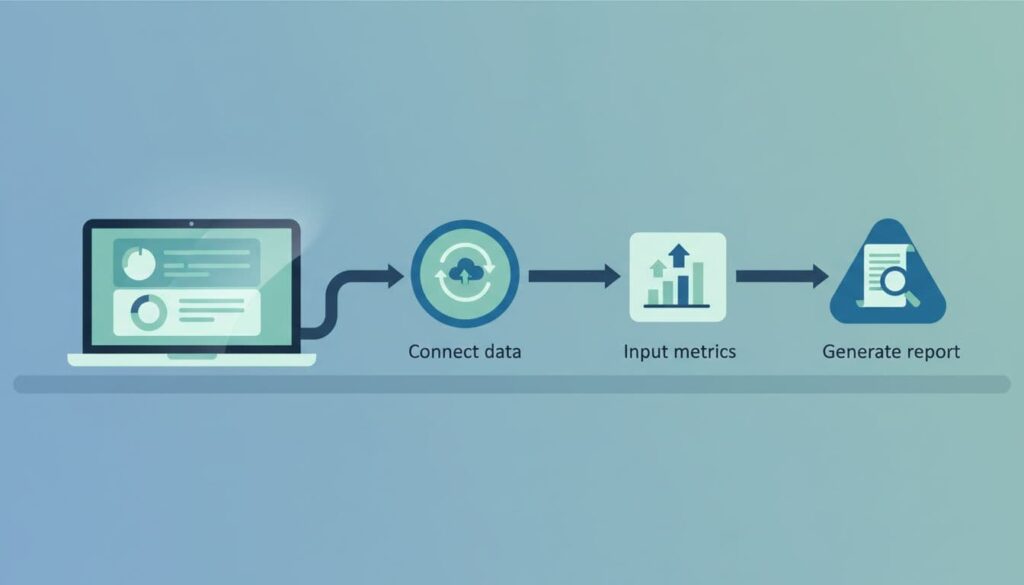
Setup takes minutes. The real work is checking the data. A fast import of messy billing records produces a polished but wrong number.
- Connect the billing source. Baremetrics lists its supported billing platforms on the official site. Confirm yours there before you sign up.
- Add missing data. When revenue lives in more than one system, review the data options in the Baremetrics help center so no revenue sits outside the model.
- Check the base metrics first. Verify customer counts, MRR, ARPU and churn before you look at LTV.
- Create segments. Split by plan, region, signup date or acquisition source. Blended averages hide weak groups.
- Compare cohorts over time. A single snapshot can mislead. Cohorts show whether retention improves or a good month fooled you.
Baremetrics offers plans based on annual recurring revenue bands. The pricing page lists Launch, Growth and Scale tiers. Segmentation depth differs by tier, with unlimited segmentation listed from the Growth plan. The pricing page shows two sets of figures at the time of writing, so confirm the current price on the official Baremetrics pricing page before you decide.
After the data lands, compare the Baremetrics LTV with a quick manual check in a spreadsheet. If both numbers sit close, continue. If a wide gap appears, stop and fix the inputs first.
Use LTV With CAC
LTV alone does not guide spending. The ratio between LTV and CAC does. The Baremetrics guide calls a ratio above 3 a good rule of thumb and says a lower ratio signals overspending on acquisition. Treat the figure as a starting point, not a law. Cash constraints, sales cycles and margins change the right target.
Follow a simple routine. Calculate LTV by channel, not only in total. Pair each channel with its CAC. Mark channels with a ratio below 3 for review. Investigate retention before you buy more traffic for those channels. A channel with a cheap signup cost can still lose money after churn.
| Situation | Likely cause | First action |
|---|---|---|
| LTV to CAC ratio below 3 | Churn too high or CAC too high | Review retention by cohort |
| LTV rising but cash tight | Annual prepay inflates the view | Compare monthly and annual plans |
| LTV differs across plans | Plan mix or pricing gaps | Segment by plan and test pricing |
| LTV falls after a launch | New channel brings weak fits | Check the cohort from the weak channel |
Segment LTV to Find the Real Story
One average number can hide two stories, a healthy core and a leaking edge. Segment before you act. Compare plan-level LTV to see whether premium tiers keep customers longer. Compare regions to find markets with weak retention. Compare signup months to learn whether product changes helped.
Baremetrics also covers more advanced modeling. The company publishes a post on predictive lifetime value models for teams wanting to forecast beyond historical averages. Use the simple formula first. Add predictive methods only when the basics are stable.
Validate Before You Act
When CLV looks too good, inspect the data. Several issues bend the result.
- Duplicate customers: two records for one account inflate counts and lower ARPU.
- Refunds and test payments: remove them from the revenue base.
- Plan migrations: a moved customer can appear as a cancellation and a signup.
- Mixed billing cycles: annual prepayments make value look richer than retention supports.
- Failed payments: a card failure is not the same as a customer who leaves by choice.
- Small samples: a new tier with six customers can show heroic LTV for one quarter.
The Baremetrics guide also discusses sample size. For fewer than 100 users, the guide suggests counting 50% or more of user data, with 100% best. For 1,000 to 10,000 users, the guide suggests 10%. Read the guide for the full scale and the reasoning.
Separate failed payments from voluntary cancellation before you diagnose churn. A billing problem needs a payment fix. A value problem needs a product or pricing fix.
Common Mistakes
- Mixing monthly and yearly ARPU in one formula.
- Using revenue LTV when margin LTV drives the decision.
- Quoting a company-wide average to guide a single channel.
- Treating one strong quarter as a trend.
- Skipping the manual cross-check after setup.
- Ignoring the discount rate when cash timing matters.
Who Uses the Number
Founders use LTV to set acquisition limits. Finance teams use the figure for payback planning and board reports. Growth teams use segment-level LTV to pick groups for upsells, win-back offers and retention tests. Support teams can use the figure to prioritize high-value accounts when resources run thin.
FAQ
What is the simplest CLV formula for SaaS?
Divide ARPU by monthly churn. Baremetrics states this version in its LTV guide. Use a monthly ARPU and a monthly churn rate in decimal form.
What is the difference between CLV and LTV?
In SaaS, the terms describe the same idea. Baremetrics uses LTV in its documentation.
What is a good LTV to CAC ratio?
The Baremetrics guide calls a ratio above 3 a good rule of thumb. Your own margins and cash position may justify a different target.
Why use a 0.75 discount rate?
The discount rate accounts for future cash flow losses and produces a more conservative estimate. Baremetrics uses 0.75 in its example.
Should you calculate LTV by segment?
Yes. Plan, region and signup cohort often differ sharply. Segment-level numbers guide decisions better than one blended average.
How often should you review LTV?
Review the figure monthly and after any pricing, onboarding or channel change. Compare cohorts, not only totals.
Conclusion
A customer lifetime value calculator earns its place when the inputs are clean. Confirm ARPU and churn, pick the formula fitting your caution level, pair the result with CAC and segment before you act. Baremetrics speeds up the setup, but the decisions still depend on your checks. Verify plan details on the official Baremetrics pages and start with one segment this week.
