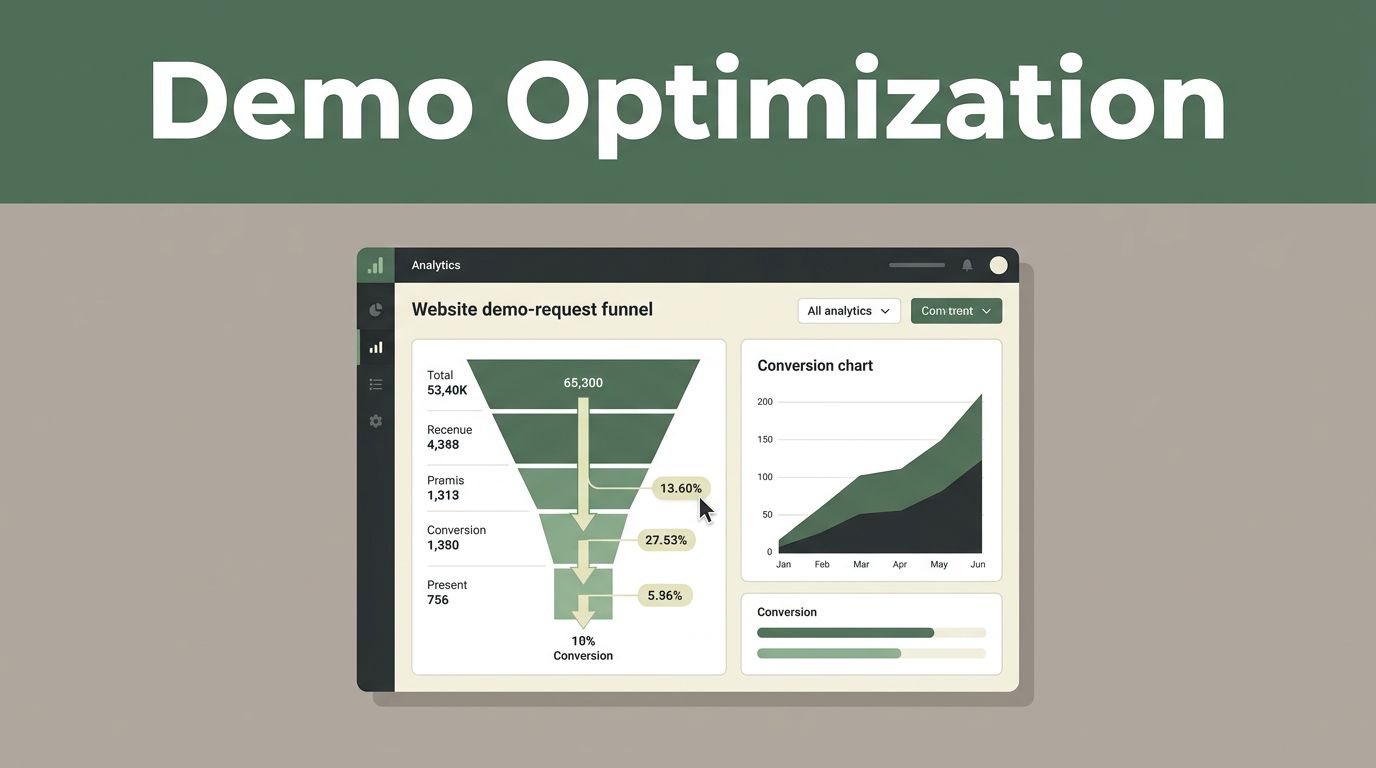
Getting high-intent traffic to your website is expensive, and watching those visitors bounce without booking a meeting drains your pipeline. Most growth teams try to fix this leak by guessing at copy changes or redesigning entire pages from scratch. That approach wastes engineering hours and leaves you with inconclusive data. You need a structured testing workflow that connects specific user friction points to measurable conversion gains. Focusing your conversion efforts on demo request optimization helps turn passive visitors into qualified pipeline without inflating your ad spend.
Key Takeaways
- Establish precise conversion hypotheses before launching tests, ensuring every experiment links an observed user problem to a specific design or copy change.
- Protect your page performance and core metrics by auditing script weight, monitoring load times, and treating Core Web Vitals as strict test guardrails.
- Segment your analytics data by device type and traffic source to confirm that global wins do not hide poor performance on mobile viewports.
- Evaluate absolute conversion counts alongside percentage lifts to avoid deploying shallow variations based on statistically insignificant sample sizes.
- Connect your experimentation platform with your CRM and analytics stack to track downstream pipeline quality rather than relying on vanity metrics.
Establishing Your Baseline Conversion Rates
You cannot improve what you refuse to measure. Before you draft a new headline or adjust a form field, pull your current conversion metrics directly from Google Analytics 4. Industry research on B2B conversion rate optimization best practices shows that average performance varies wildly by traffic source, device type, and industry vertical. Mobile visitors rarely convert at the same rate as desktop users, and paid search traffic behaves differently than organic social clicks.
Look past your blended average and inspect specific funnel steps. Calculate your drop-off rates from pricing page views to trial form starts, and from trial form starts to completed demo requests. If your baseline data is noisy or incomplete, your experiment analysis will yield unreliable conclusions. You need a clear numerical starting point before any traffic split begins.
Building a Clean A/B Test in Mida
A strong test begins with a specific problem. “Improve the homepage” is not a test brief. “More visitors should request a demo” is closer, but it still lacks the change and the reason. Write your hypothesis in one sentence: Changing the demo form from six fields to four will increase completed submissions because visitors can finish it with less effort.
Create your control version first so you have a clean baseline. The control represents the current page that receives the standard experience. Then build one meaningful variant using the visual editor. Testing five unrelated changes at once can produce a winner, but it won’t tell you which change caused the result. For additional context on structuring high-intent SaaS pages, you can review this guide on must-have components for demo request pages.
| Metric Type | What It Measures | Common Pitfall |
| --- | --- | --- |
| Exposures | Number of users entering each variation | Uneven traffic splits skewing confidence |
| Conversion Rate | Percentage of visitors completing the primary goal | Relying on tiny sample sizes |
| Guardrail Metrics | Page load speed, error rates, and bounce rates | Ignoring negative side effects on mobile |
Monitor your primary metrics and guardrails closely while the test runs. When evaluating your findings, look beyond top-line numbers. A variant that wins overall may underperform for mobile users or specific traffic sources that matter most to your bottom line.
Guarding Against Speed and Performance Loss
Conversion optimization tactics often fail when extra testing scripts slow down page loading times. Data shows that a large percentage of mobile visitors abandon sites that take over three seconds to load, and each additional second of delay drops your conversion rate significantly. Protect your Core Web Vitals by auditing every script you inject for an experiment.
Mida.so is engineered for performance, but your implementation strategy still matters. Keep your tracking scope limited to the specific pages and audiences that require testing. Treat Largest Contentful Paint and Cumulative Layout Shift as hard test guardrails. If a high-converting variant introduces an annoying layout shift or delays your main hero image, reject the update. A modest conversion gain is never worth a slower mobile experience that frustrates your best prospects.


Segmenting Results Across Key Channels
An overall result can hide important differences. Mida lets you inspect performance by useful audience dimensions when those dimensions are available in your experiment setup and report. Start with segments that match the test. For a responsive landing page change, compare desktop and mobile. For a paid acquisition test, compare traffic sources or campaign groups.
Segment analysis can answer questions that the overall report cannot. Does the variation improve mobile conversion but reduce desktop conversion? Does paid search respond differently from organic traffic? Does the result hold for new visitors? Define your audience narrow enough to explain. Visitors from the enterprise campaign who viewed pricing is useful. All high-value visitors is not useful until you define high value.
Tracking Downstream Business Metrics Beyond Clicks
Paid media dashboards often report vanity metrics that look great on agency spreadsheets while failing to reflect actual revenue growth. A shorter form or a flashy button can easily spike your click-through rate while attracting low-quality leads that never convert into paying customers. You need to connect your experimentation platform with your CRM and billing system to measure actual pipeline creation.
A winning variation loses its long-term value if the testing script depresses your baseline conversion rate or floods your sales team with unqualified leads.
Review absolute conversion numbers alongside percentage changes. A minor lift derived from a handful of transactions can easily trick an eager team into deploying a losing variant. Wait until you hit your required sample size and achieve statistical confidence before making permanent changes to your product pricing or core messaging. For a broader strategic perspective on modern testing programs, explore this B2B conversion rate optimization playbook.
Documenting and Shipping Your Results
When your test reaches statistical significance, record the outcome inside your experiment log. Classify the result as won, lost, inconclusive, or technically invalid based on your data guardrails. If the variant wins, define the permanent implementation steps for your development team. If the test loses, document what the outcome rules out so you don’t repeat the same mistake in future quarters.
Keep your stakeholders informed with clear reports that outline what you changed, what the experiment measured, and what the financial impact was. Store the hypothesis, launch date, primary metric, sample size, and final conversion rate in your workspace notes. This documentation prevents your team from repeating past experiments and builds an institutional knowledge base that accelerates future growth.