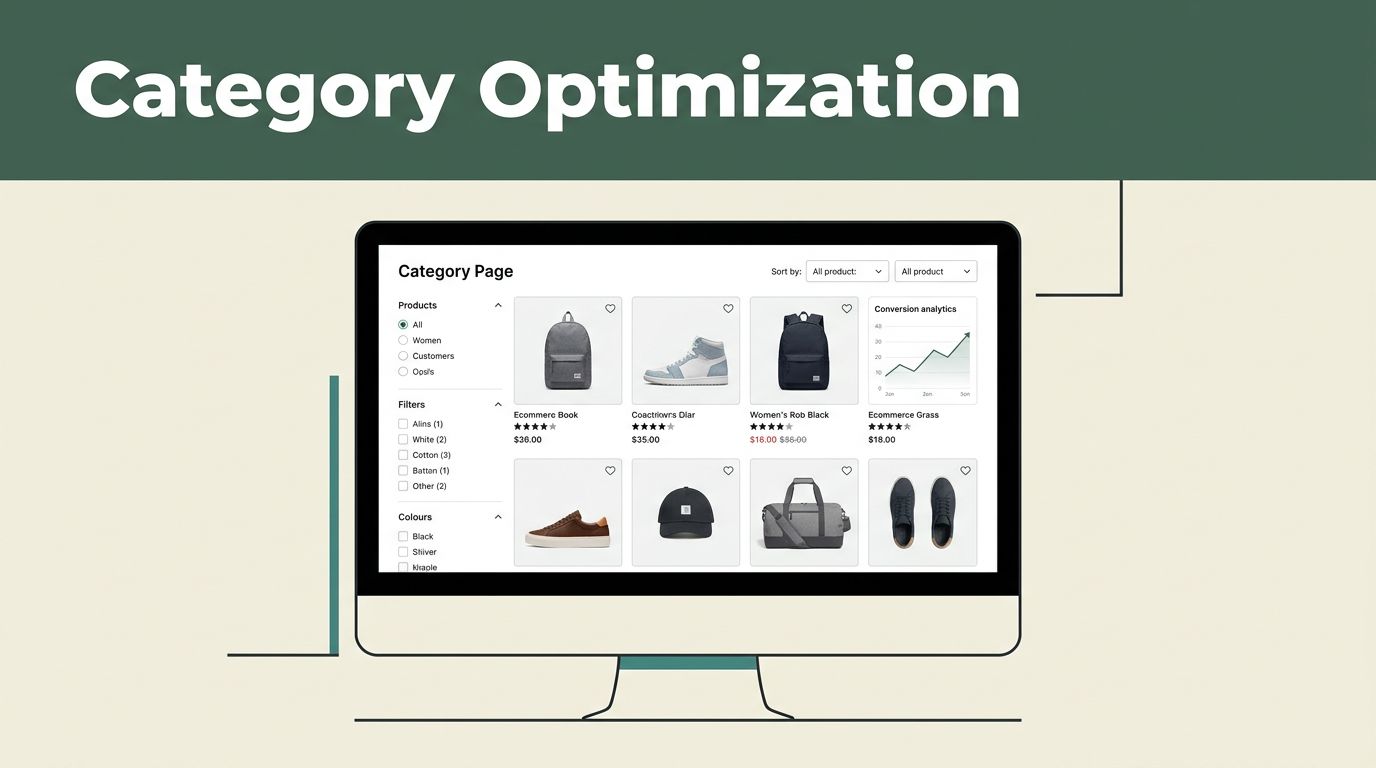
Most ecommerce websites leak potential buyers before they ever reach a product checkout screen. You drive traffic through paid ads, social media, and search engines, yet your visitor counts rarely translate into completed orders. Bumping up conversions isn’t about guessing what color button works best today. It requires a systematic approach to user behavior, rigorous testing, and structured experimentation. Mida.so gives you the testing infrastructure you need, but tools only work when you pair them with a disciplined process for ecommerce category optimization.
Key Takeaways
- Compare your baseline performance against trusted global conversion rate benchmarks before launching new category experiments.
- Start every test with a single, clear hypothesis that connects an observed user problem on category grids to a measurable change.
- Use Mida.so to test layout updates, filtering enhancements, and sort options without slowing down page rendering.
- Segment your performance across mobile shoppers, paid traffic, and returning visitors to find where variants actually drive transactions.
- Define strict decision rules and statistical confidence thresholds before checking live test results to prevent false reporting.
Assessing Your Baseline Conversion Rates
You cannot improve what you refuse to measure. Before you touch a single line of code or draft a new promotion, pull your current conversion metrics directly from Google Analytics 4. Industry research shows that performance varies wildly by traffic source, device type, and industry vertical. Mobile shoppers rarely convert at the same rate as desktop users, and paid search traffic behaves differently than organic social clicks. Look past your blended average and inspect specific funnel steps. Calculate your drop-off rates from category views to product list clicks, and from product list clicks to cart additions.
Global ecommerce websites typically hover at a conversion rate between 1% and 4%, with industry averages sitting close to 2.74%. When your store lags behind those marks, you don’t need a complete site redesign. You need a systematic way to find friction on your catalog pages, run structured experiments, and deploy fixes fast. Mida.so gives growth teams a lightweight platform to build, test, and personalize category templates without waiting on engineers.
For teams looking for lightweight testing alternatives, exploring Mida.so features and capabilities reveals how modern experimentation platforms handle these precise traffic allocations without enterprise bloat.
Formulating Hypotheses for Category Page Tests
Growth teams waste countless hours arguing over design opinions because they lack clean data. You launch a new grid variant, watch the traffic trickle in, and realize your testing tool slows down the entire site. Mida.so solves this bottleneck by providing a lightweight experimentation layer that lets you run split tests without hurting site speed or loading heavy dependencies. When you need to scale digital marketing experimentation across multiple catalogs, choosing the right platform determines whether your optimization program drives revenue or just collects noise.
Your testing program requires a clear baseline and a targeted hypothesis. If your category bounce rate spikes on mobile devices, do not guess at a fix. Inspect your user recordings or heatmaps to see where shoppers abandon the grid. Formulate a hypothesis based on actual user friction points rather than arbitrary design preferences. For example, if users struggle to filter large product inventories, test a sticky filter drawer against the standard sidebar layout. Isolate one variable at a time so your results point to an unambiguous winner.
Configuring Experiments in Mida.so
Open your Mida.so dashboard and select the project where you want to run the test. Create your control experience and your designated variants inside the visual editor or through custom code injections. Define your primary conversion goal, such as an add-to-cart action or a category-to-product click-through. Keep your traffic allocation steady, typically using a balanced fifty-fifty split to give both experiences equal exposure. For a comprehensive overview of platform alternatives and lightweight script architectures, review this analysis on an AB Tasty alternative for fast AI testing.
+-------------------------------------------------------+
|                Mida.so Experiment Setup               |
+-------------------+-----------------------------------+
| Traffic Split     | 50% Control / 50% Variant         |
| Primary Goal      | Product-List Click-Through Rate   |
| Guardrail Metrics | Largest Contentful Paint (LCP)    |
+-------------------+-----------------------------------+
Targeting rules need strict parameters. If your category update specifically targets mobile visitors or paid search traffic, configure those audience parameters before launching. Exclude internal company traffic, automated bots, and visitors already enrolled in conflicting experiments to keep your data clean. Keep your traffic distribution steady and avoid changing audience rules while the test is active. Altering the targeting mid-stream creates a new test condition, corrupting your sample purity and forcing you to restart the measurement period.
Measuring Category Page Performance


Open your Mida.so report after launch and inspect the data in a fixed order. This prevents an attractive uplift figure from distracting you from a tracking problem. First, check the traffic split. If your plan is a fifty-fifty test, the visitor counts should remain reasonably close over time. Small differences are normal, but a large gap points to targeting rules, device restrictions, or implementation errors.
Next, check total visitors and conversions. A test with twelve visitors and three conversions has a twenty-five percent conversion rate, but that rate has little decision value. Your interpretation must account for the small sample size. Then review the primary conversion rate for every variation. Keep the raw counts visible because rates based on few conversions can easily mislead your team.
Track these core metrics to evaluate your category experiments accurately:
- Category-page conversion rate: The percentage of visitors who complete a primary transactional goal after landing on the category view.
- Product-list click-through rate: The share of shoppers who click an item card from the grid to view detailed product specifications.
- Add-to-cart rate: The proportion of catalog browsers who successfully add an item to their shopping bag directly from the listing page.
- Revenue per visitor: The total monetary value generated per session, accounting for both conversion lift and average order value.
- Bounce and engagement metrics: Guardrail numbers tracking single-page exits, scroll depth, and interaction depth to spot user frustration.
Treat early results as directional rather than final. Review sample size, experiment duration, and segment quality before choosing a winner. Avoid repeated stopping. If you check the dashboard every hour and stop as soon as the variation crosses your threshold, your false-positive risk increases. The chance result you happened to catch can look like a durable effect.
Protecting Core Web Vitals and Site Speed
Most experimentation tools rely on heavy client-side scripts that execute synchronously or block the main thread. When a browser downloads a large testing bundle before rendering your category grid, your page load speed drops immediately. Shoppers on mobile devices feel this delay the most, resulting in higher bounce rates and abandoned shopping carts. Performance overhead ruins the validity of your conversion data. If a variation improves clicks but slows down layout rendering by half a second, the frustration cancels out the design improvement.
Mida.so is engineered for performance, but your implementation strategy still matters. Keep your tracking scope limited to the specific pages and audiences that require testing. Treat Largest Contentful Paint and Cumulative Layout Shift as hard test guardrails. If a high-converting catalog variant introduces an annoying layout shift or delays your main hero image, reject the update. A modest conversion gain is never worth a slower mobile experience that frustrates your best prospects.
A winning variation loses its long-term value if the testing script depresses your baseline conversion rate or triggers layout shifts that ruin mobile usability.
Segmenting Results Across Key Audience Channels
An overall result can hide important differences in shopper behavior. Mida.so lets you inspect performance by useful audience dimensions when those dimensions are available in your experiment setup and report. Start with segments that match the test hypothesis. For a responsive category grid change, compare desktop and mobile shoppers. For a paid acquisition campaign, compare traffic sources or ad groups. For a pricing or promotion test, review new visitors separately from returning buyers.
Segment analysis answers questions that the overall aggregate report cannot address. Does the new sorting layout improve mobile conversion but reduce desktop conversion? Does paid search traffic respond differently from organic brand searchers? Define your audience narrow enough to explain clearly. Visitors from a specific paid campaign who viewed footwear categories represent a useful segment, while general high-value visitors remains too broad until defined.
Conclusion
Accurate experiment analysis protects your marketing budget from false positives and unverified assumptions. By grounding every category test in clear baseline data and strict decision rules, you turn optimization into a predictable growth channel. Document every winning variant and record what unsuccessful layout tests rule out for future quarters. For deeper strategy guides on conversion optimization principles, read insights on the Mida blog for A/B testing and CRO. Connect your experiment logs to your core analytics suite, establish your pre-launch guardrails, and start running focused catalog tests on your highest-traffic category pages today.