A clean MRR export saves time, but a bad one can send a finance review off the rails. I’ve seen a single wrong filter turn a simple monthly update into a round of confused follow-up questions.
Baremetrics makes the export path fairly direct, yet the details matter. I have to pick the right report, set the right date range, and make sure I’m not mixing MRR with another recurring metric that tells a different story.
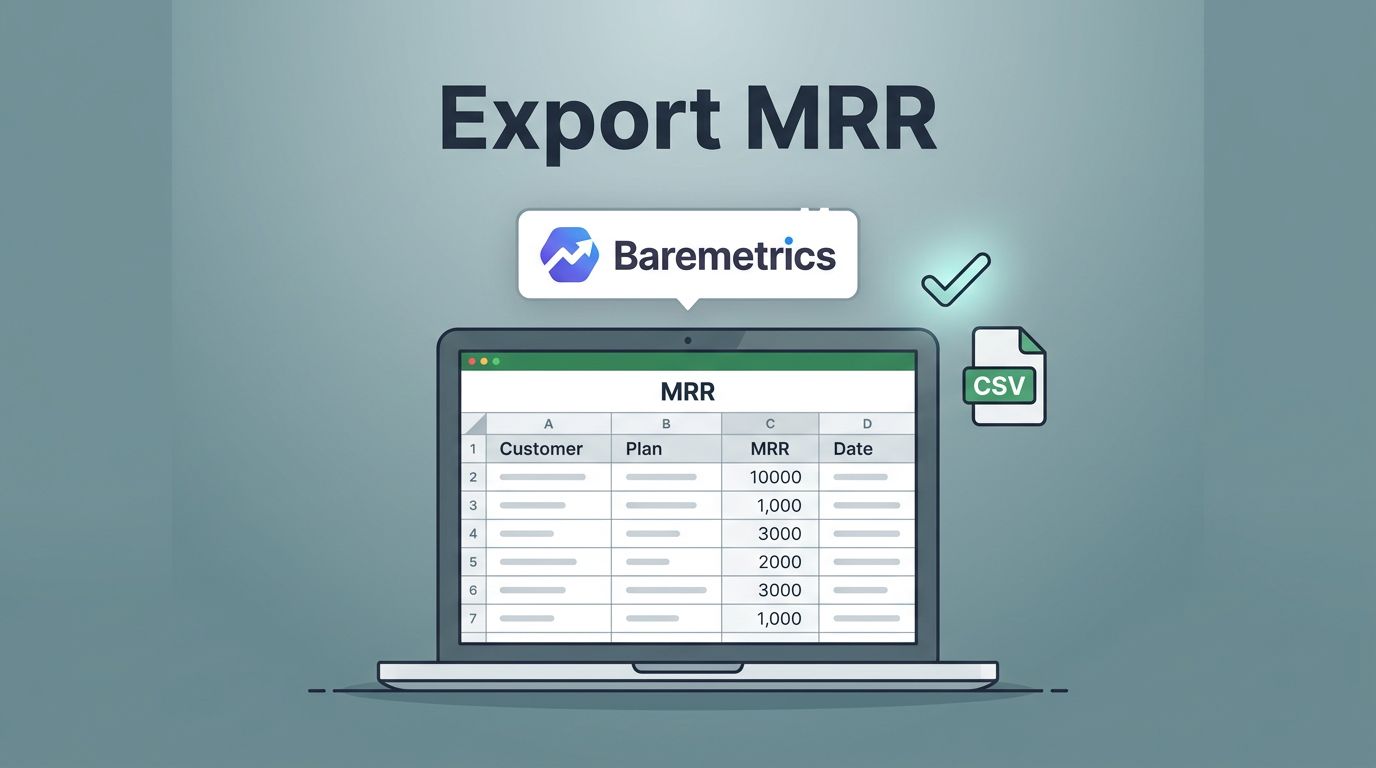
Why I pull MRR data out of Baremetrics
I like Baremetrics for fast checks, but I don’t trust a dashboard alone when I’m closing the month or building a board pack. I want a file I can sort, compare, annotate, and hand to someone else without losing the thread.
That’s why I export MRR data instead of taking screenshots. A chart is a live window. A CSV is the paper trail.

I also use exports when I need to compare MRR with other moving parts. If expansion revenue is shaping the month, I pair the export with tracking expansion revenue in Baremetrics. That keeps me from treating flat MRR like flat business.
For broader reporting, exported data is easier to move into Sheets, a warehouse, or a finance pack. Baremetrics also has a useful note on connecting data with Baremetrics if I want to move beyond one-off downloads.
The Baremetrics export path I use
The current workflow is simple once I know where to look. I use the same path every time so I don’t hunt around in settings.
- I log in to my Baremetrics account.
- I open Settings > Data Exports.
- I choose the report I want, such as the MRR report.
- I set the filters I need, usually date range, segment, and year.
- I click Export Data.
- When Baremetrics finishes, I download the file as a CSV.
If I need the same export again, I use Download Last Export. That saves a little time when I’ve already run the exact report and just need the file back.
I also pay attention to the chart view when I’m after the numbers shown on screen. Baremetrics lets me export the same data behind the graphs when I choose the matching date range first. That matters when I’m reconciling a chart with a spreadsheet.
If I choose the wrong report, the CSV is still clean, but the story is wrong.
The key is to treat the export like a snapshot. I pick the time window first, then I export what that window contains.
Picking the right report before I download anything
MRR is one metric, but it sits next to a few neighbors that can look similar at a glance. I’ve made the mistake of grabbing the wrong one before, and it always wastes time later.
Here’s the simple rule I follow. MRR is monthly recurring revenue. ARR is the annual version. Churn shows what I lost. Expansion shows what I gained inside existing accounts.
| Export choice | What I get | Best use |
|---|---|---|
| MRR report export | A CSV with MRR data for the filters I set | Monthly close, investor updates, trend checks |
| Chart data export | The values behind the MRR graph for a selected period | Verifying a chart or pulling a focused time slice |
| Download Last Export | The most recent export file again | Re-downloading a file I already ran |
When I need a cleaner view of customer groupings, I also use segment filters. That helps when I want a plan-level view, a region-level view, or a specific cohort. Baremetrics’ guide on how to import, augment, and segment customers is useful context if I’m tightening the source data before I export.
I also keep one internal check in mind. If the report I need is really about lifetime value, I don’t force it into an MRR export. I use exporting customer lifetime value data instead, because the metrics answer different questions.
What I do after the CSV lands
The download is only half the job. After that, I want the data to survive contact with a spreadsheet.
First, I open the CSV and spot-check the totals against the Baremetrics dashboard. If the numbers drift, I usually have a date-range mismatch or the wrong segment filter.
Then I clean the file for the audience. A finance lead wants a tidy monthly rollup. A founder wants the big swing in one line. An analyst wants the raw rows and enough context to test the trend.
These are the most common things I do with exported MRR data:
- I drop it into Google Sheets and build a month-over-month bridge.
- I compare MRR movement with churn and expansion so I can explain the change.
- I attach it to a board deck or investor update.
- I push it into a warehouse or BI tool when I need repeatable reporting.
If the export feeds a recurring report, I stop doing it by hand. For that kind of workflow, I look at Baremetrics’ 7 ways to use the Baremetrics API. An API-based pull is a better fit when the same dataset needs to land on a schedule.
I also use the export to answer plain business questions. Did one plan carry the month? Did a pricing change show up in the numbers? Did the renewals offset the cancellations? The CSV gives me room to test those questions without clicking through the dashboard fifty times.
Troubleshooting exports that look off
When an export feels wrong, I start with the boring checks first. That usually solves it faster than a long search.
If the file is empty or tiny, I check the date range and segment filters. A narrow window can make a healthy business look dead on paper.
If the CSV does not match the dashboard, I compare the exact period in both places. A chart can show one range while the export uses another. That mismatch is easy to miss.
If I cannot find the export option, I go back to Settings > Data Exports and confirm I’m in the right account. I also ask whether my role has access to that settings area. In teams with tighter permissions, that step saves a lot of guesswork.
If I need the same numbers often, I stop treating export as a one-off task. I set up a repeatable flow, either through the API or through a data handoff process. Baremetrics’ note on connecting data with Baremetrics is a good mental model for that kind of setup.
Conclusion
Exporting MRR from Baremetrics is simple once I treat it like a real data task, not a quick click. I open the right export area, choose the right metric, set the date range with care, and check the CSV against the dashboard before I share it.
That small habit keeps the numbers honest. It also keeps monthly reporting, planning, and investor updates from turning into a guessing game.
A good MRR export should feel like a clean receipt, not a mystery novel.