You know that sinking feeling when hiring data hides in spreadsheets? I felt it too, until I turned Recruit CRM into my command center. Scattered numbers on submissions and placements wasted my time. Now, recruitment reporting tools inside the platform give me clear views fast.
Recruit CRM packs reports that track key metrics like source performance and recruiter activity. You spot trends without exports. In this guide, I share exactly how I set it up for my agency. Let’s dive into the steps that changed my workflow.
Why Build Reporting Tools Right Inside Recruit CRM
I started because basic exports frustrated me. Recruit CRM’s built-in suite changes that. It offers real-time charts on pipelines and deals. For example, the Account Overview Report shows candidate flow at a glance.
This setup saves hours. You see job stats and team output without leaving the app. Pro plans include a full reporting suite with tweaks for your needs. As a result, decisions come quicker.
Think of it like a dashboard in your car. Gauges tell you speed and fuel instantly. Recruit CRM does the same for hiring. I focused on KPIs like conversion rates first. That revealed weak spots in my process.
External resources helped too. Check Recruit CRM’s reports and dashboards page for official examples. It matches what I built.
Setting Up Your First Dashboards
Access reports from the main menu. Click Analytics or Reports tab. Pro users get customizable options here. I picked pipeline views to start.
Choose metrics like open jobs and filled roles. Drag to build a simple board. Kanban style visualizes stages clearly. Save as your default dashboard.

This screen shows my setup with submissions charts. Plants and coffee keep the office vibe real. Soft light highlights the data focus.
Set filters by date or team. Weekly views help spot delays. In addition, alerts notify on drops in interviews. I subscribe to emails for key boards.
Test small. Build one dashboard for jobs first. Then expand. This method keeps it simple yet powerful.
Tracking Source Performance Like a Pro
Sources matter most in my agency. LinkedIn brings volume, but job boards convert better sometimes. Recruit CRM analytics break it down.
Go to Job Statistics Report. Select source column. Charts show top performers. Bar graphs compare channels over time.

Warm lamp glows over these charts in my workspace. Blues and greens make trends pop without clutter.
Filter by conversion rate. Divide placements by submissions. Low performers get cut. Meanwhile, winners get more budget.
I review monthly. One tweak doubled my best source’s output. For deeper tips, see how to build a recruitment dashboard in 4 easy steps. It aligns with Recruit CRM tools.
Monitoring Submissions, Interviews, and Placements
Pipeline reports track these core stages. Open the Deal or Candidate view. Metrics flow from submit to hire.
Submissions count candidates sent. Interviews log schedules. Placements mark wins. Percentages show funnel health.
Group by client or role. A table helps here:
| Metric | Weekly Target | My Average |
|---|---|---|
| Submissions | 50 | 45 |
| Interviews | 20 | 18 |
| Placements | 5 | 4 |
This snapshot guides adjustments. Low interviews? Check submit quality. As a result, my fill rates climbed 15%.
Automate with workflow rules. Tag high-potential submits. Reports update live. No manual counts needed.
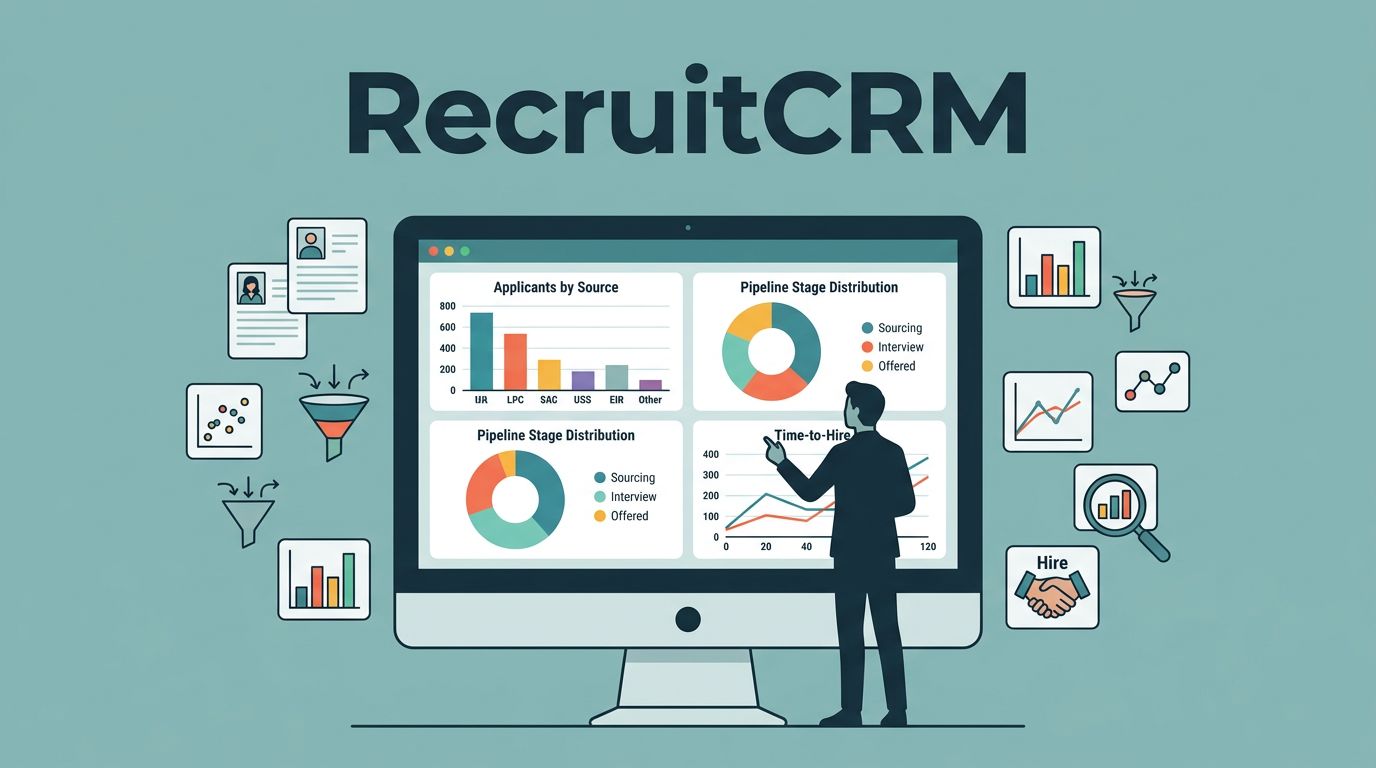
Analyzing Recruiter Performance for Team Wins
Team reports shine here. Team Performance Report lists output per person. I compare placements and activity.

Two recruiters point at pie charts in our room. Overhead light keeps focus sharp.
Pie charts split calls, emails, and closes. Top performers share tips. Laggers get coaching. Balance prevents burnout.
For our Recruit CRM advanced analytics and reporting, it ties into AI forecasts. Business plans add custom fields for deeper dives.
Sample KPI Groupings That Work
Group KPIs simply. Funnel set: submissions-to-interview ratio. Activity pack: calls per day, responses.
Source cluster: placements by channel. Recruiter bundle: revenue per placement.
Build reports around these. Export if needed, but views suffice. Advanced Analytics predicts trends too. See Recruit CRM’s advanced analytics page for forecasts.
I rotate dashboards weekly. Keeps the team sharp.
Building these tools transformed my agency. Clear metrics on submissions, sources, and performance cut guesswork. Start with one report today. Your hires will thank you. What KPI will you track first?