How I Reduce Voluntary Churn Systematically With Baremetrics
Voluntary churn rarely sounds an alarm. Customers leave by choice, one cancellation at a time, and the team sees the pattern too late. To reduce voluntary churn, you need a system showing where value breaks down for each group of customers....

Voluntary churn rarely sounds an alarm. Customers leave by choice, one cancellation at a time, and the team sees the pattern too late. To reduce voluntary churn, you need a system showing where value breaks down for each group of customers.
This guide explains how to separate voluntary churn from billing churn, which signals to watch, how to segment customers, how to run weekly retention experiments and how Baremetrics supports the work. Product facts come from the Baremetrics post on customers at risk of churn and the Baremetrics pricing page.
Separate Voluntary Churn From Billing Churn
Do not mix the two types. They look alike on a chart but come from different problems.
| Type | Cause | Typical owner | Typical fix |
|---|---|---|---|
| Voluntary churn | The customer decides the product no longer earns its place | Product, success and pricing | Better onboarding, value delivery, plan options |
| Involuntary churn | Failed payments, expired cards, bank declines | Billing and finance | Payment retries, card update emails |
Voluntary churn is a value problem. Involuntary churn is a billing problem. If you lump both together, you send the wrong team after the wrong fix.
Also split customer churn from MRR churn. Losing ten tiny accounts hurts less than losing one large account with room to expand. Add LTV to see how much future revenue leaves with each loss. Then check cohort retention to learn when customers start to drift.
Customer churn can stay flat while MRR churn worsens, because larger accounts leave. The reverse can also happen. Never trust one number alone. This guide to churn analysis makes the same point. Separate the type of churn, measure the revenue effect and find the stage where customers break away.
Spot Churn Signals Early

Do not wait for a cancellation email. The Baremetrics post lists several early warning signs.
- Feature-level engagement drop-offs: the post calls these among the strongest early indicators, more telling than login frequency alone.
- Payment history and usage frequency: combine both with engagement data to find at-risk customers.
- Unopened card update emails: customers who ignore these may be at risk.
- Downgrades: contraction MRR shows revenue lost from customers who reduce plans.
- Segment activity gaps: one group, such as a regional cohort, may get less value than another.
- Support signals: lower seat counts, ignored success outreach and complaints about core features.
Keep three weekly views. Track first-month retention, plan-level churn and revenue lost by segment. The views show whether the pain sits in onboarding, pricing or product fit.
Pay close attention to new cohorts. If a cohort signing up after an onboarding change drops faster than the last one, act at once. Read the Baremetrics explainer on cohort analysis for retention for the method.
Fix First Value Before You Fix Retention
Many voluntary cancellations trace back to the first weeks. A customer who never reaches first value has no reason to stay. Define first value in one sentence. Name the action a new customer must complete and the day by which most customers should complete the action.
Then measure the share of each new cohort reaching the milestone. Compare cohorts by signup month, plan and source. A low share points to onboarding friction. Shorten the setup path, remove optional steps and add a human check-in for accounts with high potential value.
The Baremetrics post also recommends driving engagement during the trial. Send emails highlighting features, explaining usage and encouraging return visits. Track which messages lead to the milestone and drop the rest.
Segment Customers Before You Try to Save Everyone

A good churn program does not chase every cancelling customer the same way. Churn rarely hits all accounts evenly, so segment first.
Baremetrics supports segmentation by attributes such as plan, signup date and region. Segment depth depends on the plan. The pricing page lists autogenerated segments on Launch and unlimited segmentation from Growth. The page showed two sets of prices when checked, so confirm the cost on the official page.
Start with practical slices.
- New customers who have not reached first value after 7 to 14 days.
- High-LTV accounts with falling usage or stalled expansion.
- Low-MRR monthly users who leave soon after month one.
- Customers citing the same exit reason, such as price, missing features or slow setup.
The 7 to 14 day window is a starting guess. Adjust the window to the time your product needs to deliver first value.
Match revenue data to stated reasons. Baremetrics gives the revenue and segment view. Your cancel flow gives the stated reason. The pricing page lists Cancellation Insights as an add-on, and the Baremetrics post says the tool helps learn why each segment cancels. Too expensive means one thing for a 29 dollar account and another for a 1,200 dollar account with no adoption of the core workflow.
| Segment | Likely cause | First experiment |
|---|---|---|
| Stalled new customers | Slow time to value | Shorter onboarding and a human check-in |
| Price-sensitive monthly users | Cost versus perceived value | Downgrade path instead of a hard cancel |
| High-LTV accounts with falling usage | Weak adoption | Success call tied to one outcome |
| Customers with a shared exit reason | Product or setup gap | Fix the gap and test the cohort |
Build a Cancellation Reason List
Free text is hard to count. Build a short list of reasons and ask customers to pick one. Add an open field for detail. Keep the list under eight options.
- Too expensive for the value received.
- Missing a feature or integration.
- Too hard to set up or learn.
- Switched to another tool.
- Project ended or business closed.
- Poor support experience.
- Other, with a text field.
Review the counts by segment each month. A reason growing in one segment signals a targeted fix. A reason growing everywhere signals a product or pricing problem. Read the free text weekly, because short quotes explain numbers better than charts.
Run Weekly Retention Experiments
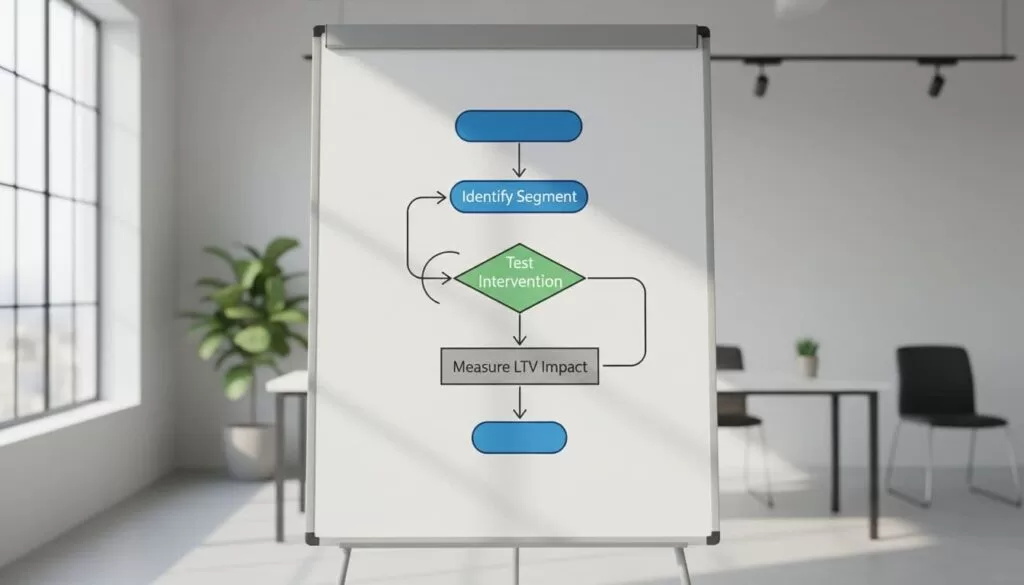
Data without a routine turns into wallpaper. Run a simple loop each week.
- Pick one segment with rising voluntary churn.
- Write one hypothesis naming the cause and the expected change.
- Launch one small intervention. Small tests move faster than large projects.
- Watch the same metrics for two to four weeks.
- Document the result. Add wins to the playbook and stop failures fast.
Judge each test the same way. Customer churn in the segment should fall. MRR churn should fall too. Cohort retention after month one should improve, and LTV should hold steady. Compare results against the cancellation reasons from your exit form. If missing integration reasons drop after a setup change, you fixed friction, not price.
The Baremetrics post lists broader tactics. The post recommends a well-defined ideal customer profile, engagement during the trial, behavior tracking, automated dunning and tailored re-engagement by segment. The post also says to prioritize high-value customers when resources are limited. See also the Baremetrics list of practical ways to reduce SaaS churn.
Offer Better Exit Paths
Not every cancellation is a loss to prevent. A good exit flow keeps the door open and gathers data.
- Ask for one reason with a short list of options and an open field.
- Offer a downgrade or pause when price or usage drives the exit.
- Offer help when setup or missing features drive the exit.
- Confirm the cancel date and data export steps clearly.
- Send a win-back message after a set period.
Keep the tone respectful. A forced retention maze damages trust and invites chargebacks. A clean exit leaves a path back.
Measure Progress the Right Way
| Metric | Signal | Watch for |
|---|---|---|
| Customer churn by segment | Share of customers lost | Spikes after pricing or onboarding changes |
| MRR churn by segment | Revenue lost | Large accounts leaving |
| First-month retention | Early value delivery | Weak new cohorts |
| Cohort retention curve | When customers drift | A steeper curve than older cohorts |
| LTV by segment | Future revenue at risk | Falling value in key plans |
| Exit reason mix | Why customers leave | One reason growing fast |
Review the table monthly. Use trends, not single data points. Small segments swing widely, so wait for enough data before you act.
Common Mistakes
- Mixing involuntary and voluntary churn in one number.
- Running a broad save campaign instead of a targeted test.
- Changing several variables in one experiment.
- Ending tests too early.
- Ignoring stated exit reasons.
- Treating all cancellations as equal in value.
FAQ
What is voluntary churn?
Voluntary churn happens when a customer chooses to cancel. The cause is usually perceived value, price, fit or support, not a payment failure.
How is voluntary churn different from involuntary churn?
Involuntary churn comes from failed payments, expired cards or bank issues. Voluntary churn comes from a decision to leave.
Which metrics matter most?
Track customer churn, MRR churn, cohort retention and LTV by segment. Read them together.
Does Baremetrics reduce churn by itself?
No. Baremetrics shows the data and offers tools such as Cancellation Insights and payment recovery. Your team still designs and runs the fixes.
How long should a retention test run?
Two to four weeks suits many small tests. Extend the period for annual plans or low volume.
Where should you start?
Pick one segment with rising churn, write one hypothesis and run one small test this week.
Conclusion
Voluntary churn feels personal because every cancellation sounds like a verdict. Treat the problem as a system instead. Split voluntary churn from billing churn, track both by segment, study cohorts and test one fix at a time. Confirm Baremetrics features and prices on the official pages. A slow leak becomes a flood only when nobody checks the pipe.
