SaaS Revenue Forecasting in Baremetrics: Scenarios for Hiring and Runway
A revenue forecast can look polished and still fail the first time churn ticks up. One canceled subscription, one delayed renewal, or one messy billing export can bend the whole picture. I use SaaS revenue forecasting to answer practical qu...
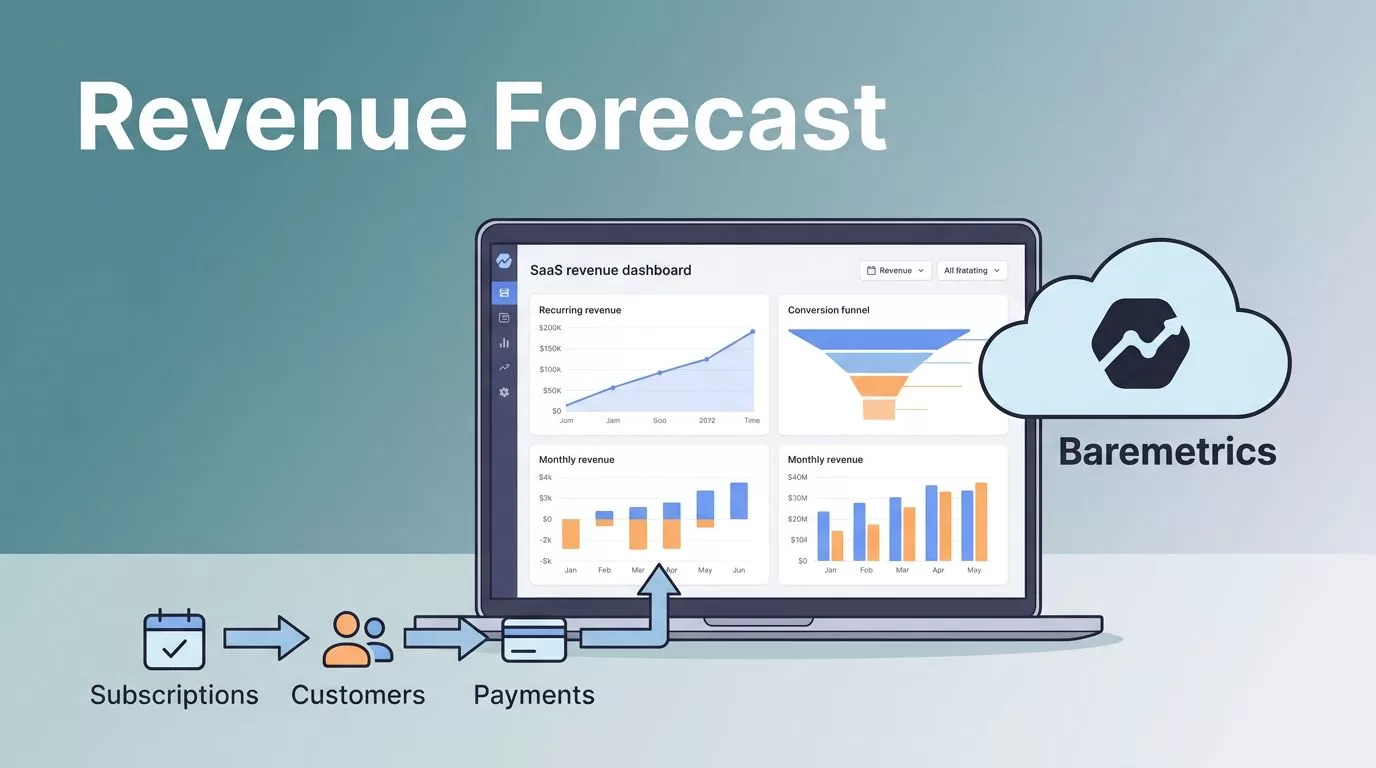
A revenue forecast can look polished and still fail the first time churn ticks up. One canceled subscription, one delayed renewal, or one messy billing export can bend the whole picture.
I use SaaS revenue forecasting to answer practical questions, not to impress a board with a neat chart. Can I hire now? How long does runway last? Should I raise spend, or hold cash for another quarter?
Baremetrics helps because it puts subscription data in one place. The model only works, though, when I feed it clean inputs and keep the assumptions honest. That is where I start.
Clean billing data before you trust the numbers
I never start with the forecast line itself. I start with the data that feeds it.
If my billing records are dirty, the forecast is already off. Duplicate subscriptions, stale canceled accounts, mismatched plan names, and one-time charges mixed into recurring revenue all create noise. Baremetrics can surface the pattern, but it cannot fix a broken source system for me.
I keep a close eye on the metrics that matter most, which is why I use key SaaS metrics for financial forecasting as my baseline reference. MRR, ARR, churn, expansion revenue, failed charges, and cancellations tell me far more than one blended growth number.
Before I model anything, I check these fields:
| Input | Why I care | What I clean up first |
|---|---|---|
| MRR by plan | Shows the true recurring base | Remove duplicates and misclassified plans |
| Churn and contraction | Reveals revenue loss | Split cancellations from downgrades |
| Expansion revenue | Shows upsell strength | Separate upgrades from one-time fees |
| Failed payments | Exposes collection risk | Fix retry logic and dunning gaps |
That table usually tells me where the model will wobble. If annual plans sit next to monthly plans without any segment split, the forecast hides a real pattern. Monthly customers often churn faster, while annual customers can look stable even when renewal risk is growing.
I also keep finance and sales in the same conversation. CRM data, billing data, and accounting records need to agree on the basics, or the forecast becomes a fight over definitions. In 2026, I want at least 12 months of history when I can get it. Less than that makes seasonality hard to read.
For a broader framework, I compare my setup with Stripe’s SaaS revenue forecasting guide. It helps me check whether I am modeling the right drivers, not just the right headline number.
Turn Baremetrics into a forecast view
Baremetrics is most useful to me when I treat it as a live revenue lens. It gives me current subscription metrics, which makes the forecast more grounded than a spreadsheet built from memory.
When my Baremetrics setup includes forecast views, I use them as a starting line. I don’t treat them as the final answer. The same goes for benchmarks. They give me a useful sense of where I stand, but my company still needs its own assumptions.
I keep that planning view next to my operating data, which is why I think about using Baremetrics for financial planning. I want the current month, the trend line, and the next few scenarios in one mental frame.
The model I build usually starts with this simple structure:
Current MRR + new MRR + expansion MRR – churn – contraction = projected MRR
That is not fancy, but it works because it mirrors how subscription revenue moves. If I sell annual plans, usage-based add-ons, or custom contracts, I split those pieces out first. Fixed recurring revenue and variable revenue do not behave the same way.
I also keep cash and revenue separate. Cash can arrive early on annual prepay, while recognized revenue rolls out over time. If I mix those up, runway planning gets messy fast.
I trust a forecast more when I can explain every driver behind it.
That is where Baremetrics helps most. It gives me the live metrics that make each driver visible. Then I can decide whether the next change belongs in pricing, sales, product, or collections.
Build the model around revenue drivers
A strong forecast does not come from one average growth rate. It comes from the parts underneath it.
I break revenue into new customers, renewals, expansion, contraction, and churn. That split matters because each piece reacts to a different force. New business depends on lead flow and conversion. Renewals depend on retention. Expansion depends on product value. Churn depends on service quality, pricing fit, and payment health.
I also use more than one method. Time trends help me see seasonality. Cohort analysis shows me whether newer customers behave better or worse than older ones. Pipeline data helps me estimate future new business. If I only use one lens, I miss something important.

The image above matches how I think about the model. I want everyone looking at the same shape of the business, not separate versions of it.
That is also why I segment forecasts. SMB and enterprise customers do not behave the same way. Channel mix matters too. A forecast that blends paid search, partner deals, and outbound sales into one number can hide weak spots. If one segment slows down, I want to see it quickly.
For a quick map of model types, I compare my approach with common revenue forecast models. It keeps me honest when I decide whether a time-series view, a bookings view, or a driver-based model fits the business best.
Use scenarios to plan hiring and runway
Once I have a baseline, I build three cases. I use a base case, a downside case, and an upside case because no single forecast deserves blind trust.
The best case tells me what happens if conversion improves, churn stays low, and expansion holds. The base case uses current trends without wishful thinking. The downside case shows me the cost of slower new MRR or a few bad renewals. That is the one I watch closest when I plan cash.
I keep this tied to action. If the base case holds, I can hold my hiring pace. If the downside case lands, I may delay a hire or cut one line of spend. If the upside case shows real traction, I can budget more for growth.
I keep the workflow tied to SaaS revenue forecasting strategy because the model has to support decisions, not just analysis. The forecast should tell me whether I can afford more headcount, a larger paid channel push, or a longer runway buffer.
A simple scenario table helps me think clearly:
| Scenario | What changes | What I do |
|---|---|---|
| Base case | Current churn, current conversion, normal expansion | Keep the plan steady |
| Downside case | Slower new MRR, weaker renewals, higher failed charges | Slow spend and protect runway |
| Upside case | Better close rates, lower churn, stronger expansion | Increase budget with more confidence |
That table gives finance and operations the same language. It also keeps me from overreacting to one strong week or one weak month.
Refresh the forecast on a schedule
A forecast gets stale fast if I leave it alone. I update mine monthly at a minimum, and weekly when growth is moving quickly.
Each refresh starts with actuals. Did churn spike? Did expansion slow? Did a deal slip out of the month? Did payment failures rise after a billing change? Those answers matter more than defending the old model.
I also compare forecast to actual, line by line, so I can see where the model drifted. If the error came from a one-time issue, I fix the source and move on. If the error came from a bad assumption, I rewrite the assumption. That loop is how the forecast improves.
This is where cleaner billing data pays off. Once I remove duplicate subscriptions, split annual from monthly plans, and separate usage revenue from fixed fees, the forecast settles down. Segmentation helps too. A small enterprise loss can matter more than ten SMB cancellations, depending on the contract mix.
If I want the model to keep its shape, I also keep the update cadence steady. Same cut date. Same segment filters. Same definitions. That discipline makes trend lines easier to trust, and it keeps finance, sales, and operations working from the same view.
Conclusion
I build a SaaS forecast by starting with clean data, then turning Baremetrics metrics into a model I can explain. The goal is not a perfect prediction. The goal is a forecast I can use to hire with confidence, protect runway, and set a budget that matches the business.
When the numbers are clean and the scenarios are honest, Baremetrics becomes more than a dashboard. It becomes a planning tool I can run the company on.
