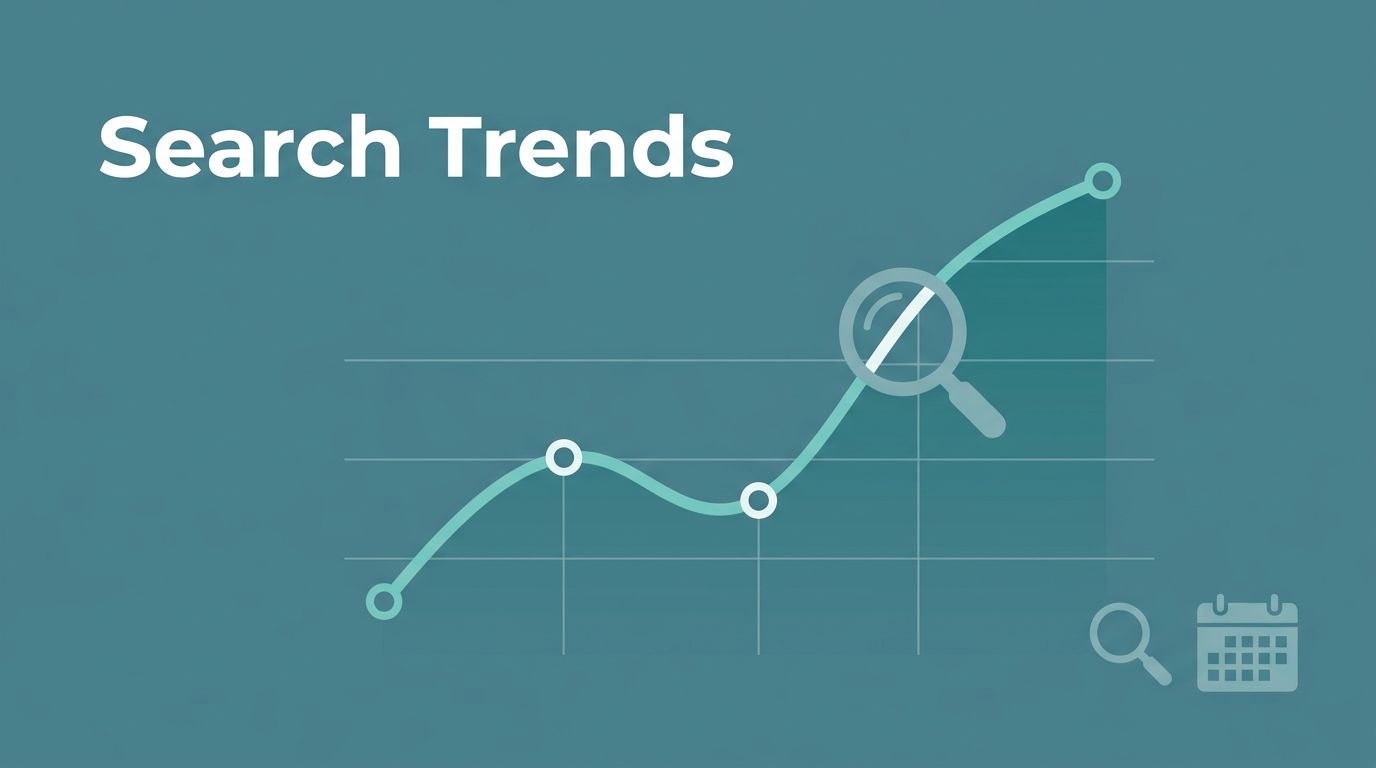
Search volume history tells me whether a topic is building real pressure or just making noise. A sharp spike can look exciting, but it often fades before I can use it.
When I work in Exploding Topics, I care about the shape of the climb, not only the size of the bump. That keeps me from wasting time on trends that look loud for one week and flat the next. It also helps me turn stronger signals into content plans, product ideas, and keyword briefs.
This is how I read the chart, what I ignore, and how I validate the signal before I trust it.
Why search volume history matters more than a single spike
A single burst of interest can come from a press mention, a viral post, or a short-lived news cycle. That matters, but it doesn’t always mean durable demand. I want to know whether people keep searching after the first wave settles.
For marketers, founders, and SEO teams, that longer view changes the whole decision. I can time a content push better, avoid stale angles, and spot topics that still have room to grow. When I see a clean rise over months, I treat it as a working signal, not a guess.
That’s also where my 2026 exploding topics brief method comes in. Once I trust the movement, I turn it into a usable plan instead of staring at a chart.
What I look for inside Exploding Topics
Direction, duration, and fit

I start with the line itself. Is it rising in a steady way, or does it jump and flatten? A slow climb usually gives me more confidence than a jagged peak.
Next, I check how long the movement has lasted. In April 2026, that matters more than ever because AI noise can flood every feed. If a topic keeps moving for months, I pay closer attention. If it only wakes up for a few days, I slow down.
I also ask whether the topic fits my audience. A trend can be real and still be wrong for my site, my funnel, or my buyers. That’s why I like to pair the chart with using trends for niche research 2026. It helps me move from curiosity to a market I can serve.
How I keep short spikes from fooling me
A spike can feel like a shortcut. In practice, it often acts more like a flare. It lights the sky, then disappears.
I trust a spike only when it keeps growing after the first burst.
When I compare signals, this is what I want to see.
| Signal | I trust it when… | I slow down when… |
|---|---|---|
| Search path | it climbs for months | it jumps for a few days |
| Related terms | nearby queries rise too | only one term moves |
| Demand shape | the line stays steady | the line snaps back fast |
That small check saves me from chasing hype. I also use Google Trends search volume explained when I want a broader read on timing and seasonality. Google Trends gives me relative interest, so I use it as a compass, not a final number.
If a topic only rises after a launch clip, a TikTok sound, or a news flash, I treat it carefully. That may still become content, but it rarely becomes a safe long-term bet.
How I validate the signal with broader keyword data
Search volume history tells me if demand lasts. Keyword data tells me how people ask for it. I need both before I build anything around a topic.
I usually look for the words people attach to the topic. Phrases like “best,” “pricing,” “alternative,” and “for teams” tell me the searcher is getting closer to a decision. Broad curiosity words tell me the idea may still be too loose.
I also compare the trend with Exploding Topics’ trend tracking guide and a second keyword source. That mix helps me see whether the topic has real commercial weight or only surface buzz. If I can’t find buying language, I wait.
This is the point where accuracy matters most. A trend that looks good in one tool can fall apart when I check intent, competition, and related searches. Good validation makes the difference between a useful topic and a nice-looking dead end.
The monthly workflow I reuse
I keep my process simple so I can repeat it without overthinking.
- I save topics with steady movement, not one-day fireworks.
- I compare the main term with related searches and phrasing.
- I cross-check the signal in Google Trends and one keyword tool.
- I decide whether the topic fits content, product, or sales work.
When I want earlier angles, I also look at low competition trend-based keywords. That helps me move from a broad trend to a page I can actually rank.
The goal is not to collect more charts. The goal is to spot a real search pattern, then turn it into something useful.
What I trust, and what I leave alone
I trust search volume history when it shows steady growth, related query lift, and a clear fit with my audience. I leave a topic alone when the chart looks like a burst of weather, loud for a moment and gone by next week.
That’s the part that keeps my work grounded. Exploding Topics gives me the first signal, but the real value comes from the way I test it. When I pair the long-term chart with keyword intent and broader validation, I make better calls and waste less time.