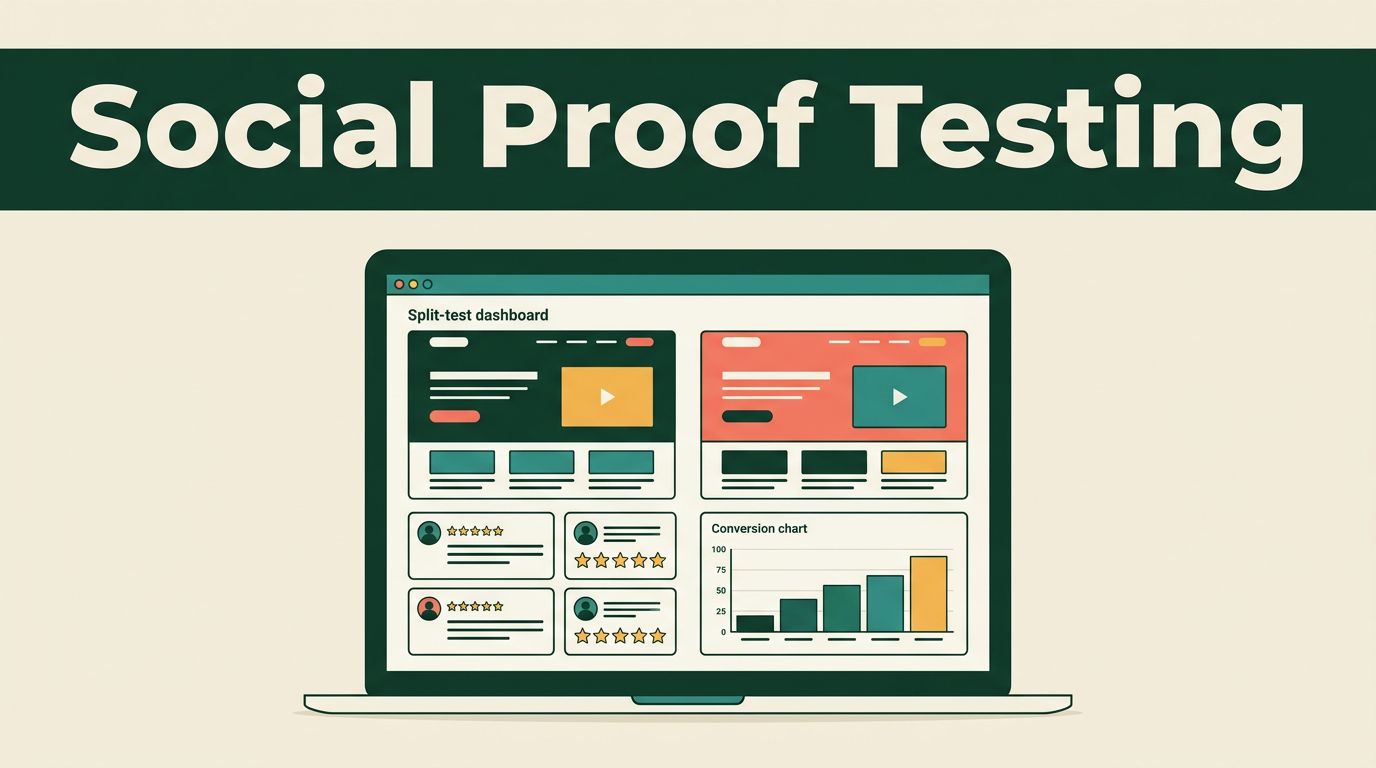
Most digital teams guess why their pages fail. They look at a stagnant dashboard, argue about button colors in Slack, and push random updates live without a shred of evidence. That routine burns traffic and wastes development hours. Bumping up conversions isn’t about guessing what proof point works best today. It requires a systematic approach to user behavior, rigorous testing, and structured experimentation.
Mida.so gives growth teams a lightweight platform to build, test, and personalize pages without waiting on engineers. When you want to validate whether customer reviews, ratings, or trust badges actually drive revenue, a controlled split test is the fastest route. This guide walks you through the exact steps to launch and analyze a social proof test without corrupting your data.
Key Takeaways
- Establish baseline conversion rates and traffic stability before launching any new experiment on your pages.
- Formulate clear hypotheses based on user friction points rather than random design tweaks.
- Monitor segment performance across mobile devices and paid traffic sources instead of relying solely on aggregate totals.
- Define strict decision rules and statistical confidence thresholds before checking live test results to prevent false positives.
- Document every test outcome to build a reliable internal knowledge base for future campaigns.
Establishing Your Baseline Before Launching
You cannot improve what you refuse to measure. Before you touch a single line of code or place a testimonial on your landing page, pull your current conversion metrics directly from your analytics suite. Industry data shows that average performance varies wildly by traffic source, device type, and industry vertical. Mobile visitors rarely convert at the same rate as desktop users, and paid search traffic behaves differently than organic social clicks.
Look past your blended average and inspect specific funnel steps. Calculate your drop-off rates from pricing page views to trial form starts, and from trial form starts to completed signups. If your baseline data is noisy or incomplete, your experiment analysis will yield unreliable conclusions. Record your current conversion rate, bounce rate, and core traffic distribution across mobile and desktop devices.
Choosing the Right Social Proof Type
Not all trust signals solve the same visitor hesitation. Before opening the visual editor, identify which form of social proof matches your specific conversion barrier. You can choose from several distinct categories depending on where users drop off.
Customer reviews and star ratings work best on e-commerce product detail pages or pricing tiers where validation of quality matters most. Client logos and brand badges belong near high-intent signup forms to reassure enterprise buyers. Usage counts or recent-activity notifications create urgency on fast-moving transactional flows. Test only one proof type at a time so you know exactly which element drives the lift.
Setting Up Your First Social Proof A/B Test
Log into your Mida.so workspace and select the target URL you want to optimize. Create your control version first so you have a clean baseline. The control represents the existing page that receives standard traffic. Next, build one meaningful variant using the platform editor.


Traffic allocation controls how visitors enter your test. A standard setup uses a fifty-fifty split, giving both experiences equal exposure. Keep your targeting rules precise. If your social proof update specifically targets mobile visitors or paid search traffic, configure those audience parameters before launching. Keep your traffic distribution steady and avoid changing audience rules while the test is active. Altering the targeting mid-stream creates a new test condition, corrupting your sample purity and forcing you to restart the measurement period.
A winning percentage on a dashboard doesn’t guarantee a profitable campaign rollout. You must evaluate raw conversion counts alongside percentage lifts to understand the real financial impact.
Avoiding Common Testing Mistakes
Growth teams often undermine their own experiments by making decisions too quickly or ignoring basic statistical rules. You need a pre-planned decision framework before looking at live data. Avoid checking your dashboard every hour and stopping the test the moment a variant takes a temporary lead. Random traffic fluctuations during the first few days frequently create false positives.
Another frequent error is changing experiment parameters while the test is actively running. Altering your headline, traffic allocation, or conversion goal mid-test creates a brand-new experiment. Let your test run through a full business cycle to account for weekend dips and weekday spikes. You also need to protect your page performance. If you inject heavy scripts or oversized badge images, your load speed drops and your bounce rate climbs, ruining the validity of your conversion data.
Reading Results With Business Context
A report needs more than a winning percentage to justify a product change. Start by inspecting your primary metric and comparing your control version against the variant under identical test conditions. Check how many visitors entered each variation before drawing conclusions. A test cannot produce a reliable comparison if one variation receives the bulk of your traffic due to uneven routing.
| Metric Type | What It Measures | Common Pitfall |
|---|---|---|
| Exposures | Number of users entering each variation | Uneven traffic splits skewing confidence |
| Conversion Rate | Percentage of visitors completing the primary goal | Relying on tiny sample sizes |
| Guardrail Metrics | Page load speed, error rates, and bounce rates | Ignoring negative side effects on mobile |
An overall result can hide important differences. Mida lets you inspect performance by useful audience dimensions when those dimensions are available in your experiment setup and report. Start with segments that match the test. For a responsive landing page change, compare desktop and mobile. For a paid acquisition test, compare traffic sources or campaign groups. Segment analysis can answer questions that the overall report cannot. Does the variation improve mobile conversion but reduce desktop conversion? Does paid search respond differently from organic traffic?
Cross-check your dashboard metrics against external data sources like your CRM or billing system. If your split test increases form submissions, check whether those leads actually convert into qualified opportunities down the funnel. A variation might show a higher click rate while driving lower-quality leads into your CRM.
Documenting and Shipping Your Results
When your test reaches statistical significance, record the outcome inside your experiment log. Classify the result as won, lost, inconclusive, or technically invalid based on your data guardrails. Store the result alongside your original hypothesis and recommendation.
If the variant wins, define the permanent implementation steps for your development team. If the test loses, document what the outcome rules out so you don’t repeat the same mistake in future quarters. This documentation stops your team from presenting an analytics dashboard without a clear decision attached. Keep your stakeholders informed with clear reports that outline what you changed, what the experiment measured, and what the financial impact was.
Conclusion
Running a social proof A/B test stops guesswork and turns conversion optimization into a disciplined engineering process. Ground every experiment in real baseline data, isolate your variables, and verify your segment performance before pushing changes live. Log into your Mida.so dashboard today to set up your first controlled variation.