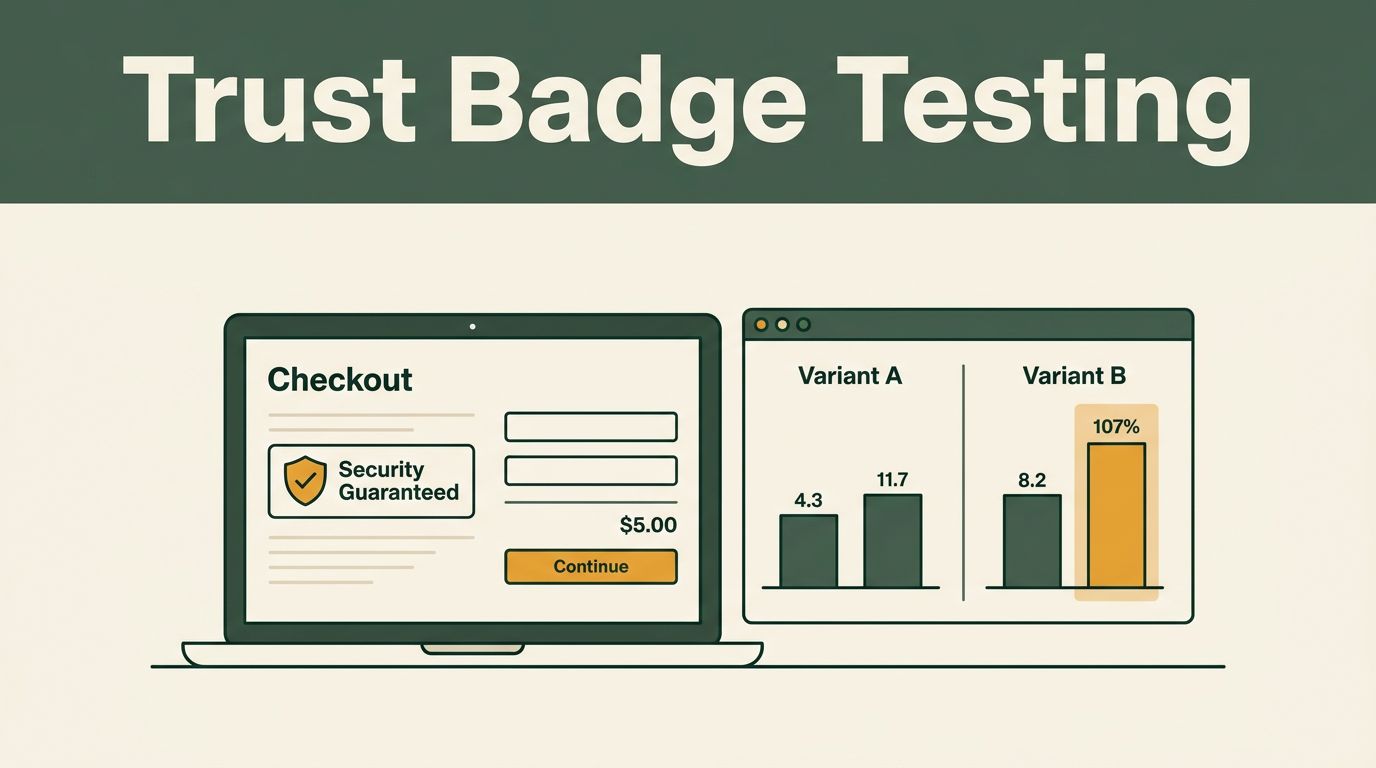
Most product teams assume that adding security seals or payment icons to a checkout flow will immediately lift conversions. They drop a row of recognizable logos onto a page, wait a few days, and assume the resulting numbers prove success. Trust signals matter, but guessing their impact is an expensive way to run a conversion program. You need concrete data from controlled experiments rather than optimistic assumptions.
Effective trust badge testing requires a structured approach to traffic splits, segment analysis, and statistical significance. When you run your experiments inside Mida.so, you gain precise control over variant delivery without slowing down your site. Evaluating those results correctly ensures you only deploy changes that genuinely protect revenue and build buyer confidence.
Key Takeaways
- Establish clear baseline conversion rates and traffic stability before launching any new experiment on your pages.
- Evaluate absolute conversion counts alongside percentage lifts to avoid deploying misleading shallow wins.
- Segment your performance data across mobile devices, paid channels, and returning users to uncover hidden friction points.
- Enforce strict decision rules and statistical confidence thresholds before checking live test results to prevent false positives.
Setting Up Your Experiment and Baseline Metrics
Before you activate a new trust variation, you need clean baseline data. Pull your current conversion metrics directly from your analytics suite and inspect specific funnel steps. Industry benchmarks show that performance varies wildly by traffic source, device type, and industry vertical. Mobile visitors rarely convert at the same rate as desktop users, and paid search traffic behaves differently than organic social clicks.
Traffic allocation controls how visitors enter your test. A standard setup uses a fifty-fifty split, giving both experiences equal exposure. Keep your targeting rules precise. If your trust badge update specifically targets mobile visitors or paid search traffic, configure those audience parameters before launching. Do not change audience rules while the test is active, because altering targeting mid-stream creates a new test condition and corrupts your sample purity.
+-----------------------------------+-----------------------------------+
| Baseline Metric                   | What It Tells You                 |
+-----------------------------------+-----------------------------------+
| Traffic Split                     | Verifies 50/50 exposure balance   |
| Primary Conversion Rate           | Measures overall goal completion  |
| Secondary Guardrail Metrics       | Catches mobile errors or speed lags|
+-----------------------------------+-----------------------------------+
Monitor your traffic split regularly to confirm that visitor counts remain reasonably close over time. Small differences are normal, while a large gap points to targeting rules or an implementation issue.
Evaluating Mida.so Results With Business Context
A report needs more than a winning percentage to justify a product change. Start by inspecting your primary metric and comparing your control version against the variant under identical test conditions. Check how many visitors entered each variation before drawing conclusions. A test cannot produce a reliable comparison if one variation receives the bulk of your traffic due to uneven routing.
Calculate your conversion rate accurately by dividing total conversions by total exposures, then multiplying by one hundred. Treat early results as directional rather than final. Review your sample size and experiment duration before choosing a winner. A test with twelve visitors and three conversions has a twenty-five percent conversion rate, but that rate has little decision value.
A small percentage difference based on a handful of conversions should never drive a site-wide redesign or a permanent pricing shift.
Review absolute conversion numbers alongside relative percentage lifts to ensure your optimizations deliver genuine commercial value. A minor lift derived from a handful of transactions can easily trick an eager team into deploying a losing variant.
Segmenting Performance Across Key Channels
An overall result can hide important differences. Mida.so lets you inspect performance by useful audience dimensions when those dimensions are available in your experiment setup and report. Start with segments that match your hypothesis. For a trust badge test on a product page, compare desktop and mobile users. For a cart page experiment, review new visitors separately from returning users.
Segment analysis answers questions that the overall report cannot. Does the variation improve mobile conversion while reducing desktop conversion? Does paid search respond differently from organic traffic? Does the result hold for returning visitors who already know your brand?
- Mobile Traffic: Monitor form usability, layout shifts, and touch target friction on smaller screens.
- Paid Acquisition: Track cost per acquisition and downstream sales value to ensure lead quality stays high.
- Returning Visitors: Measure engagement depth and watch for unintended friction on repeat navigation paths.
Define your audience narrow enough to explain clearly. Exclude internal company traffic, automated bots, and visitors already enrolled in conflicting experiments to keep your data clean.
Troubleshooting Common Deployment Issues and Noise
Technical glitches can occasionally distort your test data or reintroduce performance lag if configurations drift over time. Start your troubleshooting process by checking your browser console for authorization errors or blocked network requests. If your experiments fail to render, verify that your target URLs match the exact parameter rules you configured.
Growth teams often undermine their own experiments by making decisions too quickly or ignoring basic statistical rules. Avoid checking your dashboard every hour and stopping the test the moment a variant takes a temporary lead. Random traffic fluctuations during the first forty-eight hours often create false signals. Let your experiment run through a full business cycle to account for weekend dips and weekday spikes.
Check your guardrail metrics constantly to ensure page load speed and error rates don’t spike while your trust badges render.
If Mida.so reports conversions with a delay, leave enough time for those events to enter the dashboard before evaluating the final result. Checking a dashboard every day is good practice, but stopping a test prematurely is not.
Documenting and Shipping Your Results
When your test reaches statistical significance, record the outcome inside your experiment log. Classify the result as won, lost, inconclusive, or technically invalid based on your data guardrails. If the variant wins, define the permanent implementation steps for your development team. If the test loses, document what the outcome rules out so you don’t repeat the same mistake in future quarters.
Keep an experiment log outside Mida.so that tracks past hypotheses, dates, traffic allocations, and outcome notes. Store the reason for every decision. This prevents your team from repeating the same test six months later because nobody documented what the first result meant.
Share clear reports with your stakeholders that outline what you changed, what the experiment measured, and what the financial impact was. Plain language keeps everyone aligned and ensures your optimization program drives measurable growth.
Conclusion
Accurate experiment analysis protects your marketing budget from false positives and unverified assumptions. Grounding every trust badge test in strict decision rules turns guesswork into a reliable optimization channel. Review your active test configurations today and verify that your event payloads are flowing cleanly into your reporting views.