I remember staring at my podcast dashboard, wondering how many people actually followed my show. Downloads told part of the story, but true audience size felt like a guess. Transistor.fm changed that for me. It gives clear views into Transistor podcast analytics without the fluff.
You host episodes and push them live. Then you check real data on listeners. This post walks you through what I do each week. You’ll see exactly how to find follower estimates and growth trends right inside the platform.
Log Into Your Transistor Analytics Dashboard
I start every Monday with a quick login to Transistor.fm. The dashboard sits ready in the main menu. Click “Analytics,” then pick your show from the list. Data loads fast, even for big libraries.
Graphs pop up first. They cover total listens by day, week, or month. I scroll to episode breakdowns next. Each row shows total downloads and averages over time. Export buttons let me pull CSV files for Google Sheets.
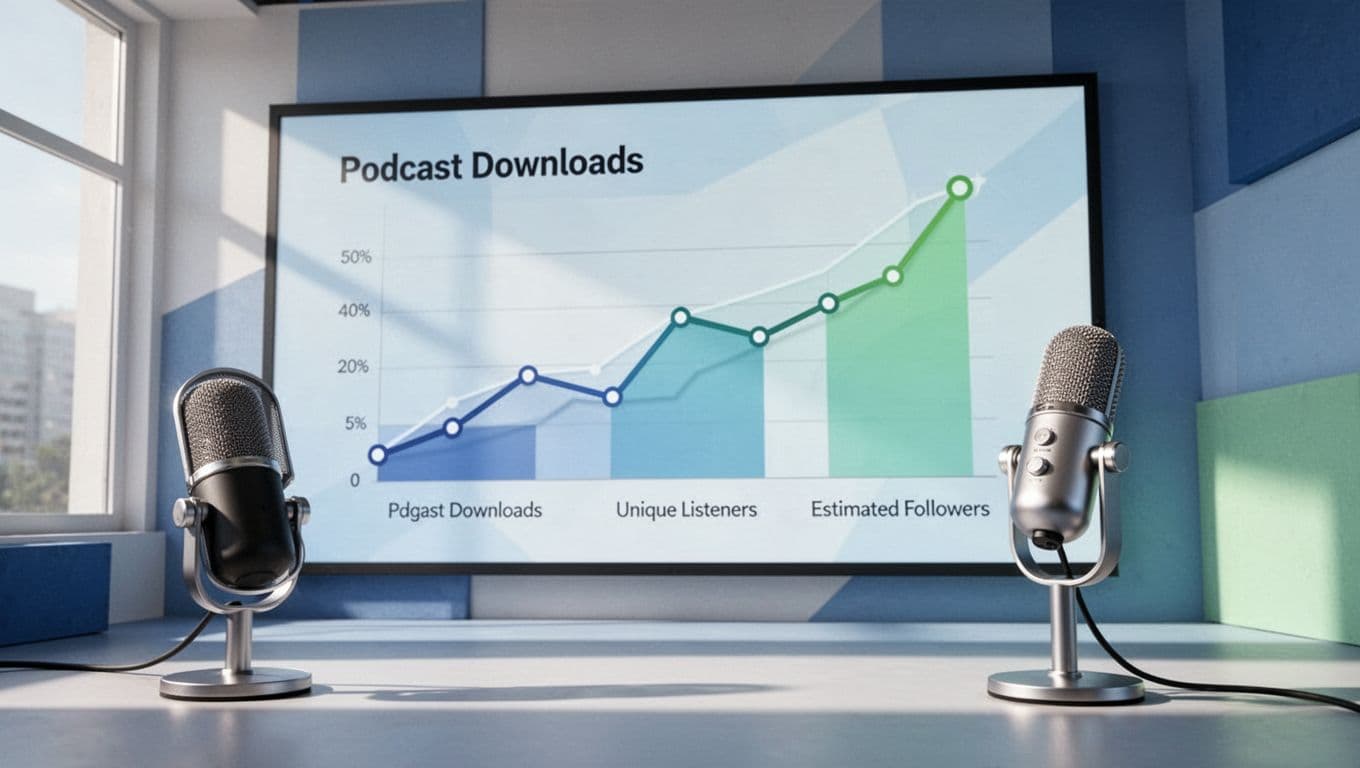
Here’s what my setup looks like during a review session.

Filters help too. Set views to 7, 30, 60, or 90 days post-release. This shows how episodes hold up. New users miss this at first. Always check multiple windows because early buzz fades.
Transistor pulls stats from all apps like Spotify and Apple. No manual imports needed. I spot patterns quickly, like weekend spikes.
For more on their setup, check Transistor’s podcast analytics features.
Follower Counts as Estimated Subscribers
True followers stay tricky in podcasts. RSS feeds don’t track individuals like apps do. Transistor estimates subscribers instead. It averages first-24-hour downloads from your last three episodes.
The graph tracks this over time. I watch for plateaus or jumps after guest spots. Last month, mine rose 15% after a viral clip. Estimates beat zero data.
Don’t chase exact numbers. Platforms like Apple give their own subscriber views separately. Transistor focuses on what it can measure well.
I cross-check with public podcast stats tools. They embed charts on my site for transparency.
Downloads, Trends, and Unique Listener Proxies
Downloads form the core of Transistor podcast analytics. I sort episodes by total listens. Top ones get 5,000 in 30 days; others trail at 500. Averages guide ad pitches.
Trends reveal growth. Monthly graphs climb steadily for me now. They dip during holidays, but that’s normal.
Unique listeners? No direct count exists. Trends act as proxies. Repeat downloads signal loyal fans. Compare episode pairs: high repeats mean steady followers.
Popular apps break it down further. Apple leads my chart at 45%. Spotify follows at 30%. Device stats show iPhones dominate.
This view helps me plan. Strong Spotify growth? Push clips there. For deeper dives, I link to Transistor listener analytics overview.
Metrics Transistor Skips and Smart Workarounds
Transistor shines on aggregates, but gaps exist. No age, gender, or location data here. Apple and Spotify dashboards fill those. Video analytics roll out soon, per their April 2026 beta.
Followers differ from subscribers too. Social-style follows happen on platforms, not RSS. I use download velocity as a proxy: quick first-day surges point to active fans.
Export CSVs weekly. I build Sheets with formulas for uniques. Subtract one-day totals from 30-day to estimate repeats.
Check listener countries in FAQs for basics. Full details need app logins.
I tie this to clip performance by reviewing Transistor analytics for viral podcast clips. Downloads spike after shares.
Grow Your Audience with Actionable Insights
Spot weak episodes fast. Low 7-day averages? Rephrase hooks. I cut intros by 30 seconds after data showed drop-offs.
Compare apps. If YouTube lags, add video versions. Trends guide schedules: my Tuesday drops beat Fridays.
Share public embeds. Fans see growth charts; it builds trust.
Test promos. Track pre- and post-campaign numbers. Mine jumped 20% after email blasts.
For hosting with strong stats, see my Transistor recommendation page.
Key Takeaways from Transistor Podcast Analytics
Transistor gives solid estimates on subscribers and clear download trends. I rely on these for decisions, not perfection. Proxies fill gaps until tech catches up.
Growth comes from weekly checks and tweaks. My show doubled listeners in a year this way.
Stick to the dashboard. Act on the data you have. Your podcast thrives from there.