Transistor.fm Predictive Analytics Review: What It Shows
Podcast teams often want one answer from analytics: which episode should we publish next, and what result should we expect? While many professional teams search for advanced podcast analytics software to help with this, the reality is that...

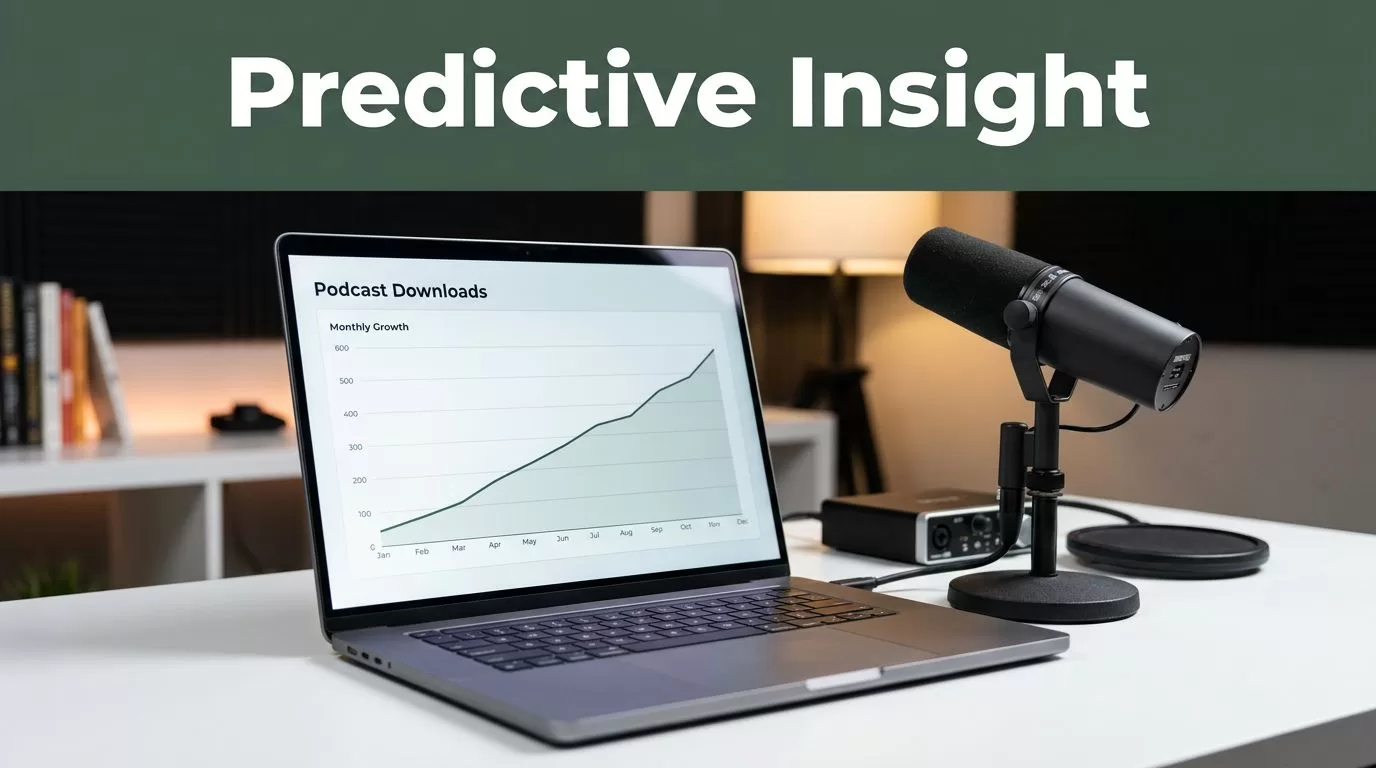
Podcast teams often want one answer from analytics: which episode should we publish next, and what result should we expect? While many professional teams search for advanced podcast analytics software to help with this, the reality is that most platforms focus on reporting past performance rather than future outcomes.
Transistor.fm provides useful hosting and audience data. It does not offer a documented forecasting system that predicts downloads, video views, or subscriber growth. That difference matters when you are evaluating Transistor.fm predictive analytics for a video podcast strategy.
As of July 2026, Transistor is stronger as a clean source of podcast performance data than as a predictive analytics platform. You can use its reports to build forecasts, but you need video-platform data and your own reporting model to complete the process. Ultimately, it remains a reliable foundation for podcast hosting and analytics.
Key Takeaways
- Transistor provides comprehensive podcast hosting and analytics, including audience trends and episode performance tracking.
- Public product information does not document a dedicated predictive analytics feature.
- Video retention, watch time, thumbnail CTR, and viewer behavior usually come from YouTube or another video platform.
- Transistor manages RSS feed distribution for audio-first shows and podcast networks that need organized host-level reporting.
- Teams seeking automated forecasts need an external spreadsheet, BI tool, or analytics platform.
What Transistor.fm Analytics Actually Provides
Transistor functions as a leading podcast analytics software that focuses on what happens after listeners request or download your content. Its analytics product page highlights audience reporting, episode performance, download trends, and listener information.
That data helps answer practical questions:
- Which episodes receive the most downloads?
- How does one show compare with another?
- What are the primary listener locations?
- Which podcast players or devices do they use?
- Does audience activity rise or fall after a publishing change?
This is descriptive analytics. It tells you what happened and helps you identify patterns. It does not automatically calculate what will happen next.
The distinction is simple. If your last six episodes generated a specific average downloads per episode, Transistor helps you see that trend. A predictive system would estimate the next episode’s likely range and explain the confidence behind that estimate.
Download data also needs careful interpretation. A download is not the same as a completed listen or a count of unique listeners. Podcast apps can request files in advance, and listeners can download an episode and never play it. Additionally, while the embedded player provides direct web listening data, the IAB Podcast Measurement Guidelines explain the standards used to filter invalid activity and define podcast download measurement.
Transistor’s reports remain useful because they give you consistent host-level data. You can compare episodes inside the same show and monitor changes over time. You should avoid treating every download as a confirmed listener action.
For network managers, the multi-show structure is valuable. You can manage several podcasts from one account and review performance without combining data from separate hosting systems. That reduces reporting work, though it does not remove the need to define consistent metrics across every show as your content is distributed to various podcast players.
Predictive Analytics Is the Missing Layer
The term predictive analytics describes a process, not a regular trend report. A predictive system uses historical data, selected variables, and a statistical model to estimate future outcomes.
A podcast forecast might use:
- First-day and first-seven-day downloads
- Episode length
- Publishing day and time
- Topic category
- Guest popularity
- Estimated subscriber count
- Promotion activity
- YouTube views and retention
- Traffic from email, search, and social channels
- AI transcription quality
- Dynamic show notes optimization
Transistor gives you part of this dataset. It doesn’t publicly document a built-in model that combines these variables and returns a forecast.
The Transistor pricing page also doesn’t list a separate predictive analytics product or add-on. Its analytics features belong to the hosting platform, which provides reliable RSS feed distribution as part of its core service. That keeps the product easier to understand, but it means your team must build the forecasting layer elsewhere.
You can create a useful model without buying a complex system. Start with a seven-day and thirty-day baseline for each show. Calculate the median result for recent episodes instead of relying on one unusually successful release. Then separate normal episodes from interviews, trailers, bonus content, and heavily promoted releases.
A basic forecast might look like this:
| Metric | Use in a forecast |
|---|---|
| First-seven-day downloads | Establish the early audience baseline |
| Thirty-day downloads | Measure sustained episode demand |
| YouTube average view duration | Check whether viewers stay with the video |
| New subscribers | Track audience growth after publication |
| Promotion source | Compare email, search, social, and paid traffic |
The model becomes more useful when you record publishing conditions. A guest episode promoted through a large email list shouldn’t define the expected result for a standard weekly episode.
Transistor can show the evidence behind a forecast. It doesn’t publish the forecast for you.
That isn’t a dealbreaker. It simply changes the buying decision. Choose Transistor for reliable podcast hosting data. Don’t choose it expecting built-in AI predictions unless the vendor documents that feature for your account and plan.
How Video Podcast Data Fits the Platform
Video adds another layer to your measurement system. While Transistor provides robust video podcast hosting, it is important to understand exactly where specific user behaviors are tracked.
Transistor helps you manage your podcast distribution and centralize your hosting data. However, a video destination like YouTube measures visual consumption through a different lens. If you utilize features like YouTube auto-posting, you gain access to a unique set of metrics that your hosting provider cannot replicate.
YouTube provides specific data points, including impressions, watch time, average view duration, audience retention, click-through rates, and returning viewers. You can review those reports directly in YouTube Analytics.
Transistor’s download count cannot replace these platform-specific metrics. A listener who downloads an audio file and a viewer who watches 70 percent of a video create different measurement events. Combining these into a single audience number can obscure performance issues. For example, if a video receives strong impressions but weak click-through rates, it indicates a problem with your title or thumbnail design. This insight is essential for effective podcast promotion and refining your marketing strategy. Another episode may receive fewer clicks but high average view duration, which suggests the content resonates once the viewer starts watching.
Transistor will not give you a full video diagnosis by itself. You need the destination platform’s reporting and a consistent process for joining the data. Apple Podcasts Connect provides another vital layer for audio distribution, allowing you to review detailed listening behavior from Apple users. Similarly, Spotify for Podcasters provides the necessary platform-level reporting for Spotify consumption.
Use each source for the specific metrics it owns:
- Transistor: hosting activity, download counts, show-level trends, distribution reporting, and video podcast hosting
- YouTube: impressions, clicks, retention, watch time, and video subscribers
- Apple Podcasts Connect: Apple listener behavior and episode engagement
- Spotify for Podcasters: Spotify audience activity and platform-specific consumption
This setup requires more effort than relying on a single dashboard, but it produces a much more accurate picture of your growth. Video teams should not make publishing decisions based on host downloads alone.
Pros, Cons, and Best Use Cases
Transistor has a clear position in this workflow. It is a podcast hosting platform with analytics, not a specialized video forecasting suite.
| Area | Strength | Limitation |
|---|---|---|
| Hosting data | Reliable podcast hosting and analytics for downloads and trends | Downloads do not prove completed listening |
| Multiple shows | Useful for managing multiple podcasts on one account | Cross-platform video data may need manual work |
| Video support | Helps include video in a broader podcast workflow | Native video retention analysis is not the main product |
| Dynamic ad insertion | Effective tools for back catalog monetization | Advanced performance attribution is not included |
| Private podcasting | Secure distribution with clear access tracking | Individual viewer-level journeys are not detailed |
| Forecasting | Historical data supports your own model | No clearly documented predictive analytics module |
| Cost control | No separate forecasting tool is required for basic reporting | Advanced forecasting still needs another system |
Transistor fits audio-first publishers that need dependable hosting and straightforward reporting. It also fits networks that manage several shows and want one operating system for distribution.
It fits video teams when Transistor is one part of the stack. You can keep podcast hosting in Transistor, video publishing on YouTube, and performance reporting in a spreadsheet or business intelligence tool.
The fit is weaker for teams that want one dashboard to predict audience growth across audio and video. It is also weaker for marketers who need campaign attribution, viewer-level journeys, or automated recommendations based on retention data.
Check the current plan details before purchasing. Video availability, analytics limits, user access, and export options can change by plan. Contact customer support to clarify plan details and ensure your required video workflow is supported directly or requires a separate publishing service.
A Practical Measurement Setup Around Transistor
You can build a workable forecasting process with four steps.
- Define one primary outcome. Choose first-seven-day downloads, thirty-day downloads, YouTube watch time, or new subscribers. Don’t combine all four into one score.
- Create a consistent episode breakdown. Store the title, topic, format, guest, duration, publish date, promotion channels, and call to action beside the Transistor data. If you are migrating your show to this platform, remember that a 301 redirect is standard if moving feeds into Transistor to ensure you do not lose your existing audience.
- Add platform-native video metrics. Import YouTube views, impressions, click-through rate, average view duration, and retention. Add Apple or Spotify data when audio engagement matters.
- Review forecasts against actual results. Use a rolling median or average for a starting baseline. You might want to track your growth using a burndown chart or similar visualization to better understand listener retention over time. Record when the forecast misses; a pattern of misses usually means the model needs more variables or cleaner data.
Keep the reporting window consistent. Compare first-seven-day performance with first-seven-day performance. Don’t compare a new episode’s three-day result with an older episode’s thirty-day total.
Use ranges instead of false precision. A forecast of 4,000 to 5,000 downloads is more useful than a claim that the next episode will receive 4,637 downloads. The range reflects uncertainty without hiding the decision, and you should monitor subscriber activity alongside your download numbers to get a complete picture of your growth.
This process also supports publishing decisions. If guest episodes produce better retention but standard episodes produce more downloads, you can assign each format a different job. If short clips generate views but few subscribers, measure them as awareness content rather than treating them as failed full episodes.
Frequently Asked Questions
Does Transistor.fm provide automated predictive analytics?
No, Transistor.fm does not currently offer a built-in predictive analytics system. It focuses on descriptive analytics, providing reliable data on past performance rather than forecasting future audience growth or download outcomes.
Can I use Transistor.fm data to build my own forecasts?
Yes, you can use the historical episode performance and audience trends provided by Transistor to build your own forecasting models. By exporting this data into a spreadsheet or business intelligence tool, you can create baselines and track metrics to project future success.
How should I track video podcast performance alongside Transistor?
Since Transistor tracks hosting data rather than visual engagement, you should use platform-specific analytics from YouTube, Apple Podcasts, or Spotify for granular insights. Combine these native metrics with your Transistor download data in an external report to get a complete view of your total audience activity.
Why are Transistor download numbers different from video platform views?
Transistor measures audio file requests and downloads based on RSS activity, whereas video platforms track unique visual interactions like impressions and retention. These metrics measure different behaviors, so they should be analyzed separately rather than combined into a single audience count.
Conclusion
Transistor.fm remains a preferred choice for podcast hosting and analytics, providing reliable data for creators who need consistent show-level insights. While it offers excellent visibility into your audience, it is not currently marketed as a dedicated podcast analytics software capable of generating advanced, high-end predictive forecasts for video performance.
Use Transistor to manage your core audio data and track standard download metrics. For deeper insights into platform-specific behavior, continue to lean on the native dashboards provided by YouTube, Apple Podcasts, and Spotify. To get the best results, aggregate these metrics into a custom model that your team can inspect and adjust as your strategy evolves.
The most effective setup is not found in a single magic dashboard. Instead, it relies on a clear separation between the data Transistor measures and the external forecasting process your team needs to drive growth.

