You run a SaaS business. Subscriptions come in every month. But cash flow spikes from annual plans fool you into overconfidence. That’s where Baremetrics ARR tracker steps in. I use it to project yearly revenue without the noise.
ARR gives a steady view of subscription value over 12 months. It cuts through one-offs and failed payments. Founders and revenue teams need this for real planning. In this guide, I walk you through my exact setup. You get clean data and dashboards that update live.
Let’s start with the basics.
Why ARR Beats MRR for Long-Term Planning
ARR multiplies your monthly recurring revenue by 12. If MRR hits $50,000, ARR lands at $600,000. MRR tracks the month. ARR shows the full year ahead.
I watch both. MRR catches quick shifts from churn or upsells. ARR smooths those for board reports. It ignores seasonal billing bumps. For example, a customer pays $1,200 yearly upfront. MRR spreads that to $100 monthly. ARR keeps the total honest.
Common mix-up: people add non-recurring fees to ARR. Don’t. Stick to subscriptions only. Baremetrics handles this math automatically once connected. Check Baremetrics’ ARR explanation for the formula details.
Pauses and discounts distort numbers too. A paused plan drops MRR but not ARR right away. I segment these in Baremetrics to spot issues fast. This setup keeps my forecasts grounded.
Connecting Your Billing Sources First
Data flows from your payment processor. I start here every time. Baremetrics pulls from Stripe, Braintree, or Chargebee. No exports needed.
Sign into Baremetrics. Go to integrations. Pick your billing tool. Enter API keys. It takes five minutes. Test the connection with a recent invoice pull.


Hands on keyboard link Stripe to Baremetrics in moments. Data streams live.
Multiple sources? Add them all. I run Stripe for most customers, Recurly for enterprises. Baremetrics merges without duplicates. If trials convert oddly, adjust mappings early.
Pro tip: enable webhooks. They push events like upgrades instantly. Polling works but lags. See Baremetrics setup guides for your processor.
Once linked, raw data appears. ARR calculates on the fly. But noise hides the signal. Next, clean it.
Cleaning Subscription Data for True ARR
Dirty data kills trust. Churned accounts linger. Discounts inflate ARPU. Failed payments pretend revenue sticks.
I scan the customer list first. Filter for active subscriptions only. Baremetrics flags pauses and fails. Exclude them from base ARR.
Here’s my routine:
- Sort by last payment date. Anything over 30 days? Investigate.
- Check discounts. Prorate them against full plan value.
- Annual plans: confirm normalization to monthly.
- Failed dunnings: Baremetrics Recover tool revives some. Track those separately.
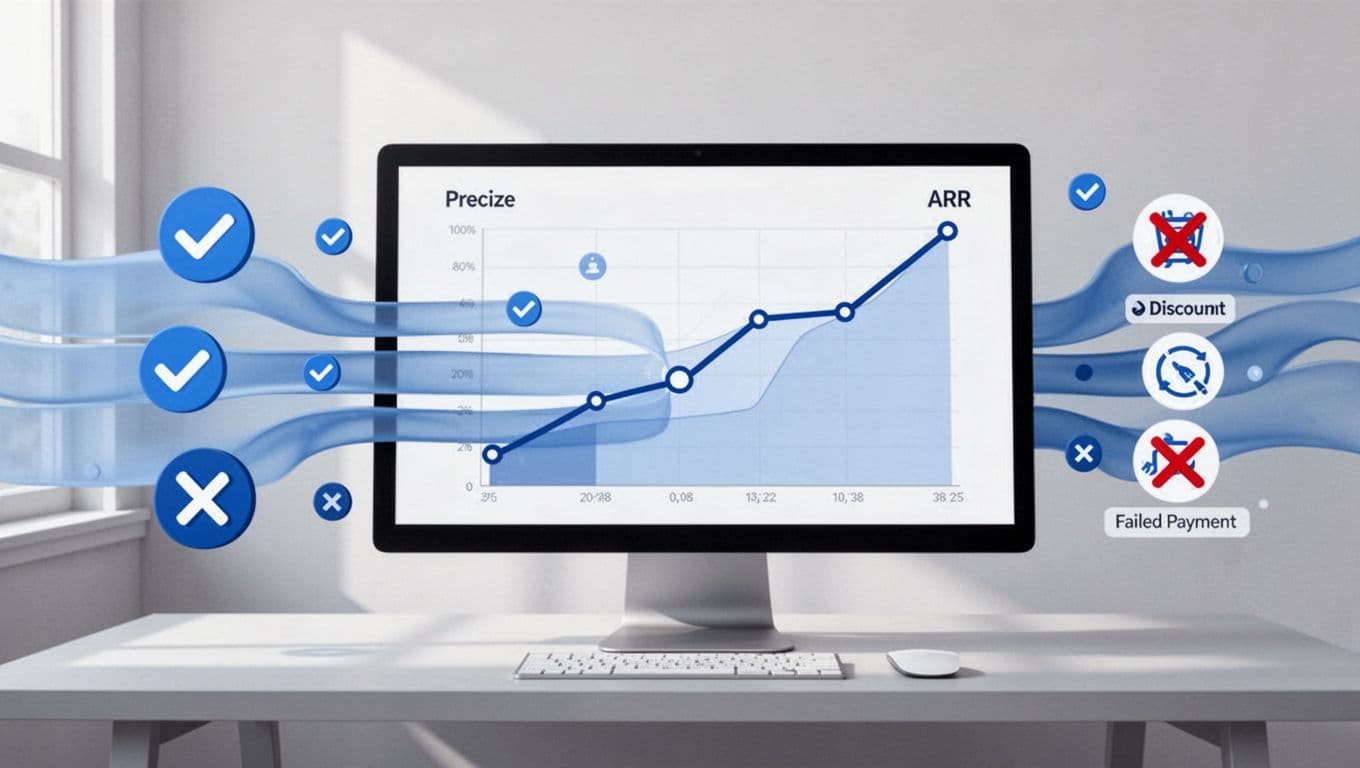
Clean streams feed accurate ARR charts. Crossed icons block the junk.
Use segments. Group by plan tier or cohort. Spot contraction fast. For instance, enterprise pauses hit ARR hard. Isolate to forecast impact.
I reconcile monthly against billing exports. Matches build confidence. Read my post on keeping SaaS revenue accurate in 2026 for MRR cleanup that pairs with this.
Clean data turns Baremetrics into your truth serum.
Building Your ARR Dashboard
Dashboards make ARR glanceable. I build one per team: founders see trends, revenue ops drill into segments.
Start in Control Center. Add ARR widget. Set date range to 12 months rolling. Layer MRR below for context.
Add breakdowns: new vs expansion ARR. Churn overlay shows leaks. Customize with filters like region or plan.

A focused ARR dashboard on my desk. Trends and metrics update live.
Share via Slack or email. Set alerts for 10% drops. Baremetrics’ guide to getting started covers custom views.
Test with history. Backfill data if needed. Now it predicts forward.
Validating Metric Accuracy Daily
Accuracy demands checks. I compare Baremetrics ARR to internal spreadsheets weekly.
Key pitfalls:
- Churn misreads: Baremetrics nets it out. Confirm against customer support logs.
- Discounts: Ensure proration matches your policy.
- Multi-year deals: Normalize correctly or segment.
- Failed payments: Watch recovery rates. They boost ARR over time.
Use benchmarks. Baremetrics shows industry averages. If your churn exceeds, dig in. Track NRR too; above 100% means growth from upsells.
For revenue recognition, pair with SaaS revenue recognition workflows. It aligns ARR with ASC 606.
Monthly close: export CSV, sum manually. Differences under 2%? Good. Fix mappings otherwise.
Common Pitfalls and Fixes in ARR Tracking
Annual plans spike MRR. ARR evens it. But group them wrong, and trends lie.
Discounts: Baremetrics applies them. Verify against invoices.
International billing: Currency conversion lags. Set base to USD early.
Scale hits limits? Upgrade plans. Free tier caps history; pro unlocks forecasts.
I review Baremetrics metrics for churn. Pairs ARR with LTV for full picture.
Fixes save hours. Your tracker stays sharp.
Make ARR Tracking Your Weekly Ritual
Setup ends. Workflow begins. I check dashboards Monday mornings. Note changes. Assign tasks: “Chase these five pauses.”
Share with teams via saved views. Founders get high-level ARR. Ops get segments.
Automate reports. Slack pings for anomalies. Export to Google Sheets for modeling if needed.
Expand to financial forecasting. ARR feeds upside scenarios.
This ritual turned my revenue blind spots into strengths. Data drives decisions now.
Conclusion
A Baremetrics ARR tracker gives SaaS teams clear yearly revenue views. I connect billing, clean data, build dashboards, and check weekly. Pitfalls like churn and discounts fade with practice.
Your business gains honest forecasts. Revenue ops run smoother. Start today; the first connection unlocks it all. ARR isn’t guesswork anymore. It’s your north star.
(Word count: 1487)