Board slides fall apart when the numbers arrive late, shift shape, or mean something different every month. I use Baremetrics to pull the revenue story into one place, then I turn that export into a board pack that I can explain without sweating through the meeting.
The trick is simple. I keep the metric set tight, export it the same way every time, and format the slides so the trend is obvious at a glance. When I already have a strong reporting layout, I use Baremetrics dashboard layout examples to keep the executive view focused.
The board only wants a few metrics
I don’t try to show everything Baremetrics can measure. Board members want the numbers that explain momentum, risk, and follow-through.
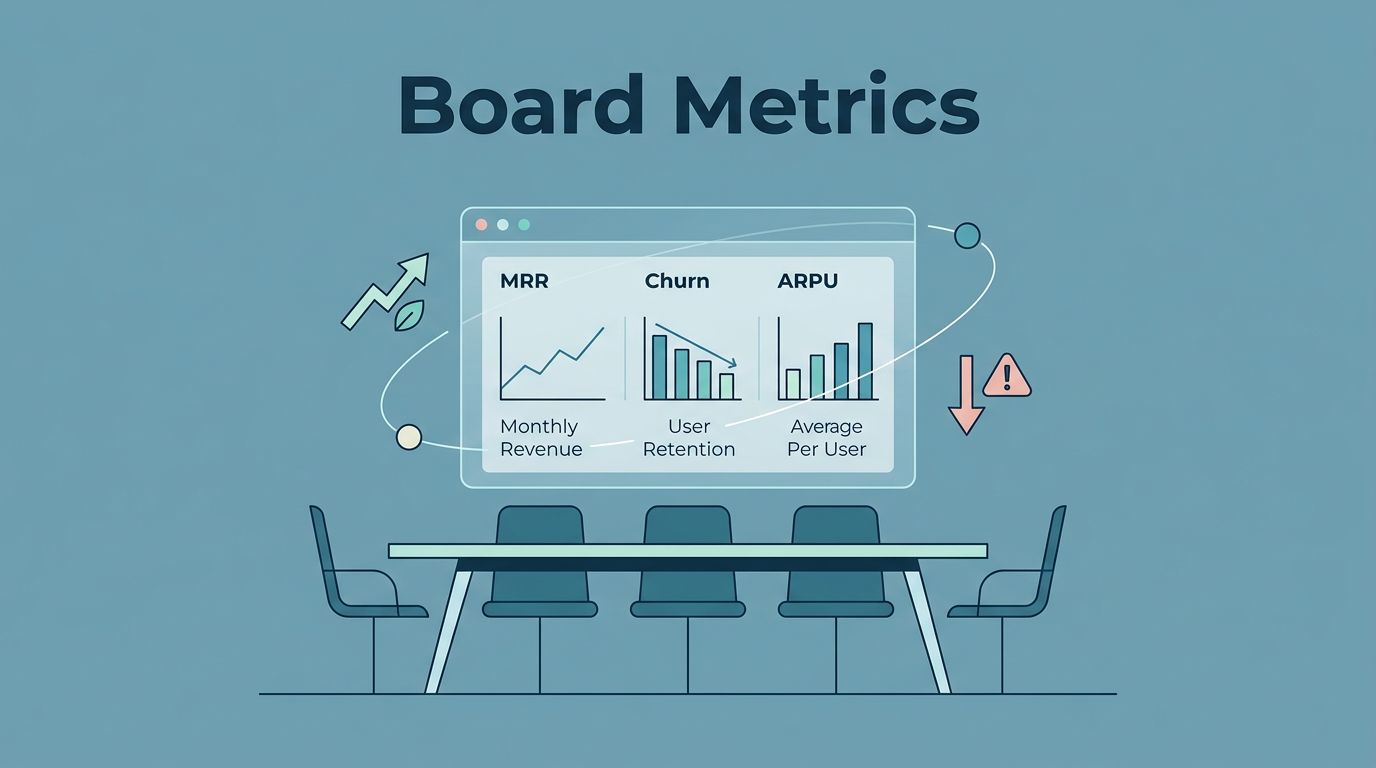
For most SaaS board packs, I start with these:
- MRR and net new MRR because they show the main revenue line.
- Churn and retention because they tell me whether growth is sticking.
- Expansion and contraction because they show the quality of the base.
- ARPU because it helps me see pricing and mix changes.
- Failed payments and collections because small billing issues can become real revenue leaks.
I keep the definitions fixed. If I change how I count churn or expansion, the slide deck loses trust fast. I like the metric rules in Investor-Ready SaaS Metrics 2026, because it pushes the same discipline I want in my own reporting.
If I need a second pass on how those numbers should sit together, I cross-check my structure against this executive SaaS metrics reporting guide. That keeps me from stuffing the deck with nice-looking charts that answer the wrong question.
Exporting the CSV the right way
Baremetrics does not hand me a board slide deck on a silver tray. I have to export the data first, then shape it into something a board can read in seconds.
Here’s the process I use:
- I go to Settings > Data Exports.
- I pick the report I need.
- I set the filters, usually date, segment, and years.
- I click Export Data.
- When the export finishes, I choose Download Last Export to get the CSV.
Baremetrics exports come as CSV files, which is exactly what I want. CSV keeps the data clean, portable, and easy to move into Sheets or Excel. Baremetrics also limits exports to six times per day for each report type, so I batch my work instead of testing the button over and over.
I keep the export file boring on purpose. Board work gets messy when every month uses a different date range or file name.
When I save the file, I name it with the month, report, and segment. That small habit saves me from confusion when someone asks why February looks different from March.
Turning raw data into board-ready slides


I move the CSV into Google Sheets or Excel first. After that, I build the chart there and paste the result into Slides or PowerPoint. That extra step gives me control over labels, colors, and the time range.
For a board pack, I usually keep one chart per slide. If a slide tries to explain three things at once, I’ve usually asked too much of it.
Here’s a simple format I return to:
| Slide | What I show | What I say |
|---|---|---|
| Revenue trend | MRR and net new MRR | Why growth changed this month |
| Retention | Churn, reactivation, cohort trend | Whether customers are staying |
| Expansion | Expansion MRR and ARPU | Which plans or segments are working |
| Billing risk | Failed payments and cancellations | Where revenue may slip next |
That structure gives me a clean story. It also keeps me from overloading the room with dashboard noise.
If the pack needs more context, I compare it with a board reporting template for growth-stage SaaS. I do that when I want to make sure my slides answer the same questions the board is already asking.
I also like to add a short sentence on each slide, usually in the footer or speaker notes. One line is enough. It should explain the movement, not repeat the chart. For example, “Expansion rose after the pricing change on the new annual plan.” That line gives the chart a spine.
What I check before I send the deck
Before I send anything to the board, I run a quick review. This part matters because a good deck can still fail on small mistakes.
I check four things:
- The export date range matches the board period.
- Every metric uses the same definition as last month.
- The totals in the slide match the CSV.
- Any change in trend has a short explanation next to it.
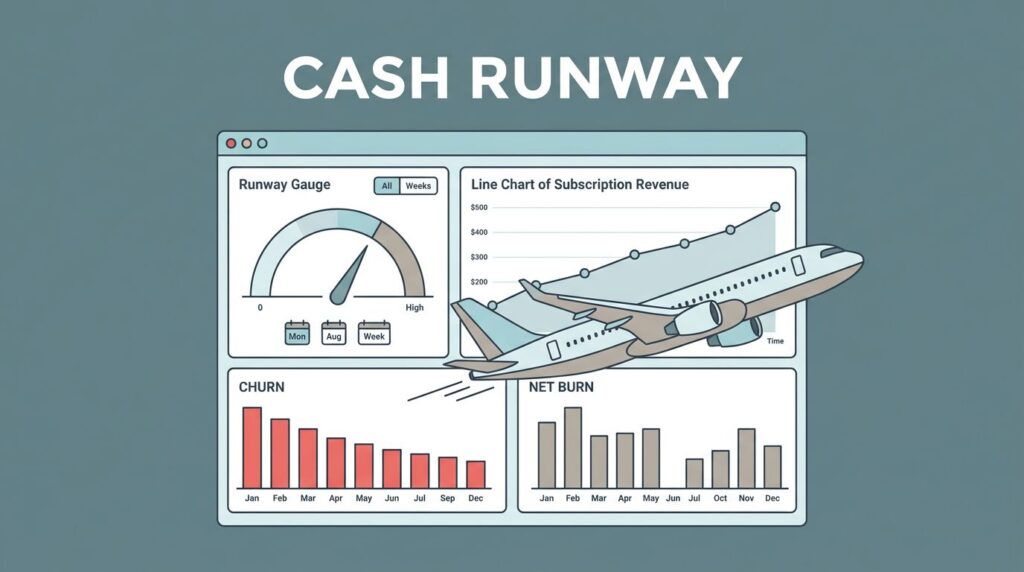
I also avoid mixing sources on the same slide unless I clearly label them. Baremetrics is great for subscription revenue, churn, and retention. If I need runway or burn, I pull that from finance tools and keep it on a separate slide. That way, the board can see where each number comes from.
When I’m short on time, I prioritize three questions: Did revenue move, why did it move, and what do I expect next month? If the deck answers those three cleanly, the meeting usually stays focused.
Conclusion
Exporting Baremetrics data is easy. Turning it into board-ready slides takes more care. I get the best result when I keep the metrics narrow, export the same way every month, and build slides that show one clear point at a time.
That approach cuts the noise. It also makes the board conversation better, because the deck tells a story instead of hiding it.