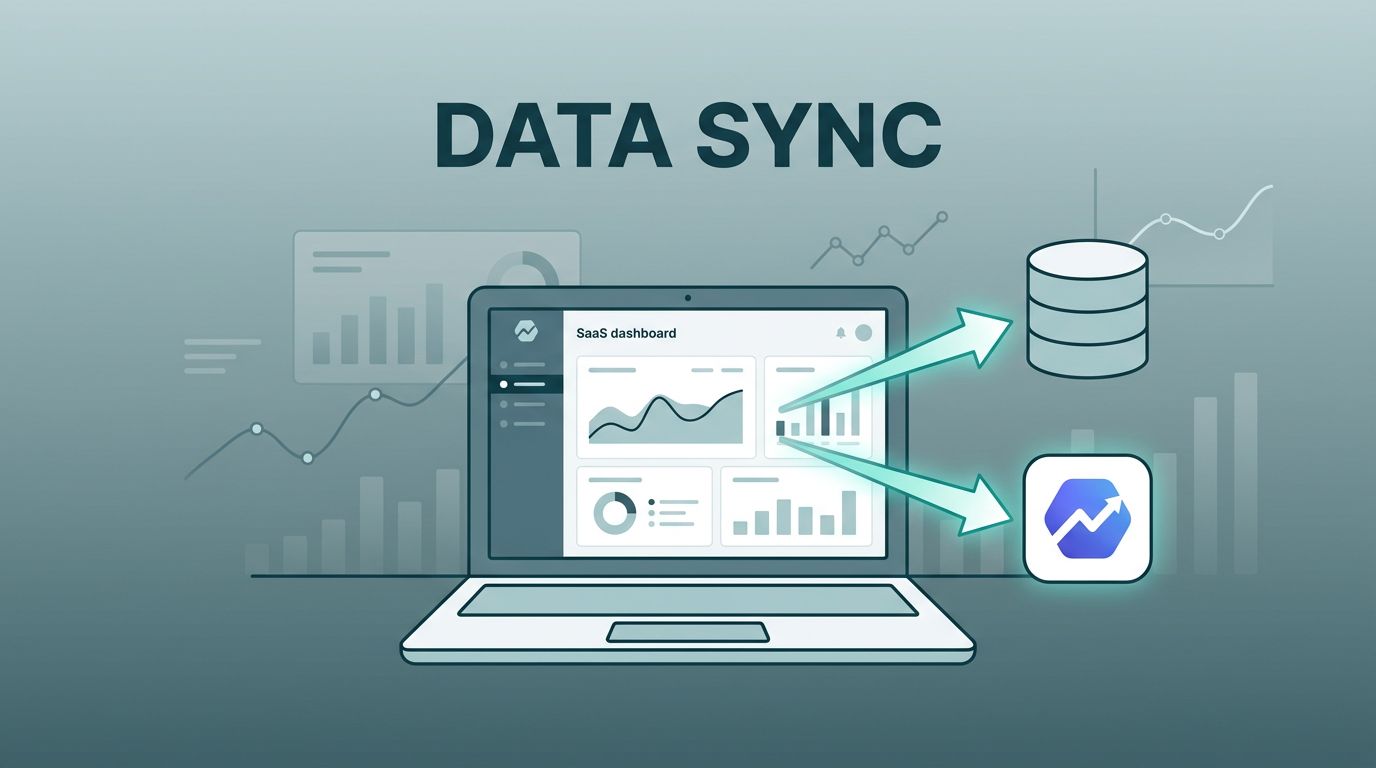
A subscription dashboard is helpful until finance, product, and data all ask different questions about the same customer. That is when I push Baremetrics into a warehouse and stop depending on exports and one-off spreadsheets.
A Baremetrics data warehouse sync gives me one place to join revenue, customer, and product data. It also keeps recurring reporting tied to the rest of my stack, instead of leaving it in a separate tool.
When I set this up well, I can answer churn, MRR, and cohort questions without rebuilding the same file every month. If I’m still deciding whether Baremetrics fits my stack, I also read my Baremetrics analytics platform review before I wire anything in.
Why I move Baremetrics data into a warehouse
The main reason is simple, I want one trusted version of subscription data. Baremetrics is strong at subscription metrics, but the warehouse is where I blend those numbers with product events, support tickets, and CRM activity.
That matters because revenue does not move in isolation. A churn spike can line up with a failed product release, a billing issue, or a change in onboarding. If I keep Baremetrics data close to the rest of the business data, I can see those patterns faster and stop guessing.
It also makes reporting less fragile. Instead of exporting CSV files, I can build scheduled queries and dashboards that refresh on their own. That saves time, but it also cuts down on copy-paste mistakes and version drift.
If I want a clean reminder of which SaaS metrics deserve the most attention, I keep tracking key SaaS metrics nearby when I plan the sync.
I treat the warehouse like the company notebook. Baremetrics writes the revenue lines, and the rest of the stack adds the context.
The data I keep synced, and why
I do not move every field just because it exists. I sync the records that help me explain revenue changes and connect them to other systems.
Here is the set I usually care about first:
| Data group | Why I keep it | Common use |
|---|---|---|
| MRR and ARR | Shows the shape of recurring revenue | board updates, month-end review |
| Churn, downgrades, and expansions | Explains where revenue is leaking or growing | retention analysis, pricing work |
| LTV and ARPU | Helps me compare customer quality | segment analysis, CAC payback |
| Customers, subscriptions, and plans | Gives each account a stable history | joins with product and CRM data |
| Invoices, payments, refunds, and coupons | Shows why the numbers changed | reconciliation, collections review |
That list gives me the core story. Once those tables are in place, I can layer in acquisition source, billing interval, country, or account tier without losing the base picture.
I also keep an eye on naming. A plan that changes names three times can make every report feel shaky. So I normalize plan labels early, and I keep IDs stable wherever I can.
What the sync pipeline looks like in practice
The setup is usually straightforward, but only if I treat it like a data project, not a one-time export. I start with Baremetrics as the source, then I send the data into Snowflake, BigQuery, Redshift, or PostgreSQL, depending on what my team already uses.
If I want a managed connector, I compare options like Portable’s Baremetrics connector with vendor docs that spell out sync behavior and destination support. I also look at DLH’s Baremetrics setup guide when I want a clear view of historical loads, incremental syncs, and re-sync options.


The biggest choice after that is cadence. Daily syncs work for most finance teams, but some teams want more frequent refreshes for dashboards. I usually match the cadence to the speed of the decision. Monthly board reporting does not need the same refresh rate as a live revenue watchlist.
I also check whether the connector can backfill history cleanly. Baremetrics data gets much more useful when I can compare this quarter with the last six quarters, not just the last few days. Historical loads matter because churn and expansion only make sense when I can see the pattern over time.
If customer IDs drift, every downstream chart gets shaky. I fix that before I touch the dashboard layer.
After the first load, I validate totals. I compare MRR, active subscriptions, and refund counts against Baremetrics itself. That first check catches mapping mistakes before they spread into BI dashboards and finance reports.
How teams use warehouse-synced Baremetrics data
The warehouse is where Baremetrics becomes more than a reporting screen. Once the data sits next to product and sales data, teams can ask sharper questions.
For BI, I can combine subscription revenue with usage events and acquisition data. That helps me see which channels bring in customers who stay, grow, or vanish early. It also lets me build dashboards that show both revenue and behavior in the same view. I often pair that work with building a Baremetrics dashboard so finance and product can read the same numbers.
For finance, the benefit is cleaner reporting. I can reconcile invoice data, refunds, and churn in one place, then close the month with fewer manual checks. The warehouse also gives me a better trail for unusual movements, like annual prepay recognition or a spike in downgrades after a pricing change.
For forecasting, the value is history. Baremetrics can show current revenue trends, but the warehouse lets me compare those trends against campaign timing, seasonality, and customer segment shifts. That makes forecasts less fragile than a spreadsheet full of assumptions.
For cohort analysis, the warehouse is hard to beat. I can group customers by signup month, plan type, region, or acquisition source, then watch how retention changes. That is the kind of view that tells me whether my best customers come from self-serve signups, partner referrals, or sales-led deals.

I like this view because it changes the conversation. Instead of asking, “What was MRR last month?” I can ask, “Which customer group drove that change, and will it hold next quarter?” That question leads to better pricing, better retention work, and better budget calls.
Implementation checks before I call it done
A good Baremetrics sync can still fail if the setup is sloppy. Before I trust the numbers, I check a few things.
- I map customer and subscription IDs before the first load, so joins stay stable.
- I confirm the warehouse schema, then I avoid changing it every week.
- I test the sync cadence against the team’s reporting rhythm, daily for finance, more often only if I need it.
- I compare totals after the backfill, especially MRR, churn, refunds, and active subscriptions.
- I decide who can see the raw tables and who only needs modeled dashboards.
I also think about edge cases. Annual plans, mid-cycle upgrades, failed payments, prorations, and refunds can all distort a report if the model is too loose. If my connector supports re-syncs or deleted-row handling, I keep that in mind as the data grows and changes.
Most teams do not need a perfect model on day one. They need a reliable one. That means clean IDs, clear ownership, and a few tight checks that catch drift early. Once those are in place, the warehouse becomes easier to trust.
Conclusion
A Baremetrics sync is most useful when I want subscription metrics to work alongside the rest of the business data. The warehouse gives me that shared space, so finance, BI, and product stop arguing over separate numbers.
I get faster reporting, cleaner joins, and a better way to study churn, MRR, LTV, and cohorts over time. More importantly, I can turn Baremetrics from a reporting tool into part of a broader data system.
That is the real payoff, one set of revenue facts, one place to analyze them, and fewer surprises when the month closes.