Net revenue retention tells me if my SaaS is quietly growing or slowly leaking cash. I track it in Baremetrics by connecting my billing data, checking NRR and GRR side by side, and tracing every dip to churn, downgrades, refunds, or failed payments.
That sounds simple, but the value is in the routine. When I review it the same way every month, the number stops being trivia and starts acting like an early warning light.
Table of Contents
- How I Set Up Baremetrics Net Revenue Retention Tracking
- How I Read the Number Without Fooling Myself
- What I Check When NRR Starts Falling
- FAQs About Baremetrics Net Revenue Retention
How I Set Up Baremetrics Net Revenue Retention Tracking
I start with clean billing data. Baremetrics pulls from tools like Stripe and Shopify, so the first job is making sure plans, upgrades, refunds, and customer records look sane before I trust the dashboard.
Then I connect my processor and let Baremetrics backfill the account history. As of March 2026, that still works through the core metrics dashboard, not some separate NRR workspace. Once the sync finishes, Baremetrics calculates NRR automatically from starting MRR 30 days ago, churned MRR, and expansion MRR.
For a plain-language reference, I keep the Baremetrics Help Center article on NRR bookmarked. I also like Baremetrics’ own explanation of net revenue retention because it keeps the math grounded in SaaS reality.
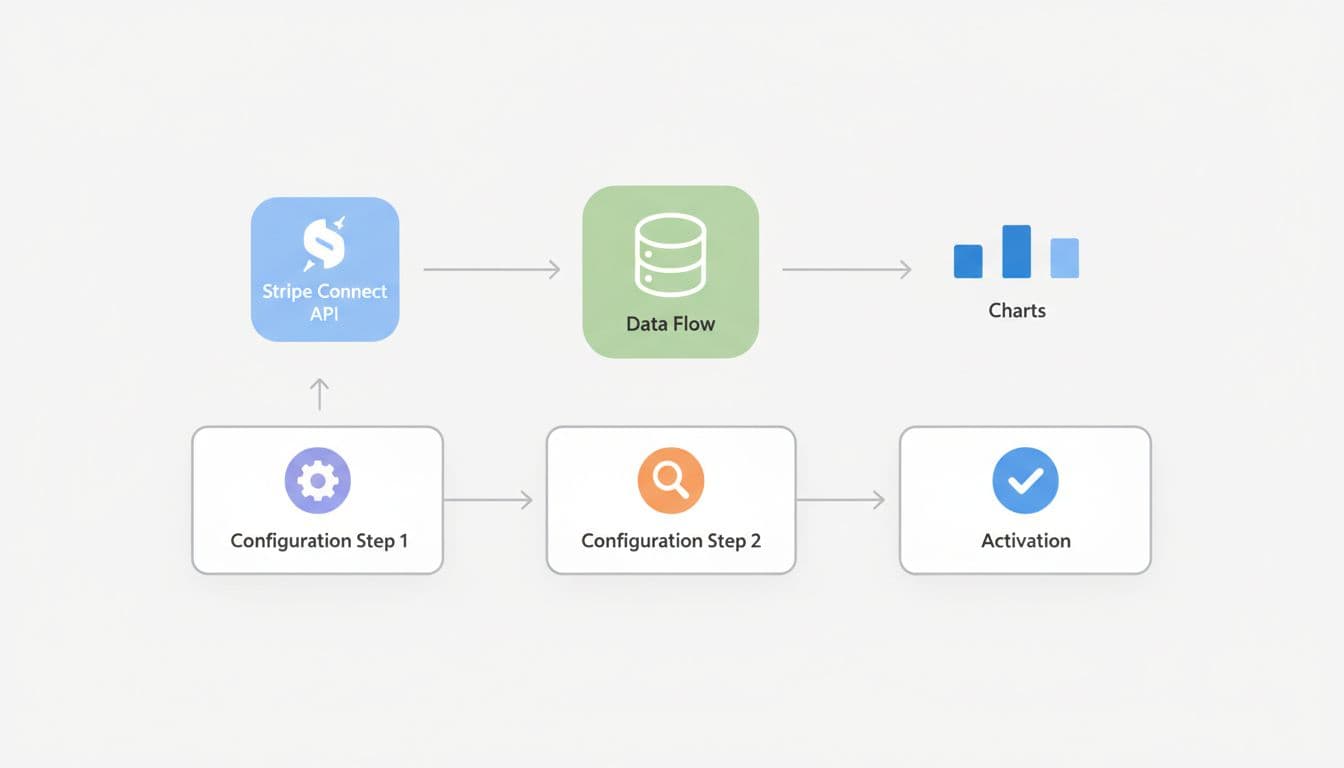
Here’s the setup flow I follow:
- Connect Stripe or Shopify to Baremetrics.
- Check that plans, refunds, and customer histories are accurate.
- Wait for the dashboard to populate, then review NRR with GRR.
Baremetrics is only as clean as the billing data behind it. If Stripe is messy, NRR will be messy too.
How I Read the Number Without Fooling Myself
I never read NRR alone. A single number can smile at me while the business coughs in the background. So I pair it with GRR, churned MRR, and expansion MRR every time.
If NRR is over 100%, existing customers are growing revenue faster than churn is shrinking it. If it’s under 100%, the bucket has a leak. That’s why I treat NRR less like a speedometer and more like a pressure gauge.
This is the scorecard I use in Baremetrics:
| Metric | What I want to see | Why I care |
|---|---|---|
| NRR | 100%+ | Shows if existing revenue base is growing |
| GRR | Stable and high | Reveals retention without upsells masking problems |
| Churned MRR | Low or falling | Shows lost recurring revenue |
| Expansion MRR | Rising | Proves upgrades are real, not luck |
I also compare my trend with outside benchmarks. Baremetrics has a helpful SaaS metrics checklist for founders, and I sometimes sanity-check targets against NRR benchmarks for SaaS.

Most importantly, I don’t overreact to one day of movement. Baremetrics updates fast, but I judge NRR as a 30-day story, not a daily mood swing.
What I Check When NRR Starts Falling
When NRR slips, I don’t start with the formula. I start with accounts.
First, I look for cancellations. Next, I check downgrades. After that, I scan failed charges and refunds, because those can drag the number down without looking dramatic at first glance.
Then I compare NRR with GRR. If GRR is weak too, the problem is retention. If GRR looks fine but NRR softens, expansion may have slowed. That difference matters because the fix is different.
For founders and finance teams, this is where Baremetrics becomes more than a dashboard. It helps me move from “the number is bad” to “these accounts changed, and here’s why.” When I need a quick refresher on how the calculation behaves, I also like these NRR calculation examples.
I also segment mentally, even if I’m reviewing a broad dashboard. SMB churn can hide behind a few large upgrades. Annual plans can make a month look stronger than it feels. So I try to read the story behind the average, not the average by itself.
FAQs About Baremetrics Net Revenue Retention
Does Baremetrics calculate NRR for me?
Yes. Once I connect billing data, Baremetrics calculates NRR automatically. I don’t maintain a separate spreadsheet unless I’m auditing edge cases.
What’s a good NRR number?
For me, 100% is the floor, not the goal. If I’m below that, my existing customer base is shrinking. Many SaaS teams want 105% to 115% or higher, though the right target depends on deal size and pricing model.
Why does my NRR look wrong in Baremetrics?
The usual cause is bad source data. Refunds, pauses, failed payments, plan changes, or messy customer records can distort the result. I check billing events before I blame the metric.
Should I track NRR daily or monthly?
I glance at it weekly, but I judge it monthly. That rhythm keeps me informed without turning normal noise into panic.
My Final Take
I use Baremetrics NRR as a flashlight, not a trophy. It shows me whether existing customers are paying more, paying less, or leaving quietly.
If you want a useful routine, start small. Open Baremetrics, compare NRR with GRR, and trace one recent change back to real accounts. That one habit can change how you read revenue.