A rising signup count can feel great, right up until revenue stays flat. That’s why I keep a close eye on trial conversion rate in Baremetrics.
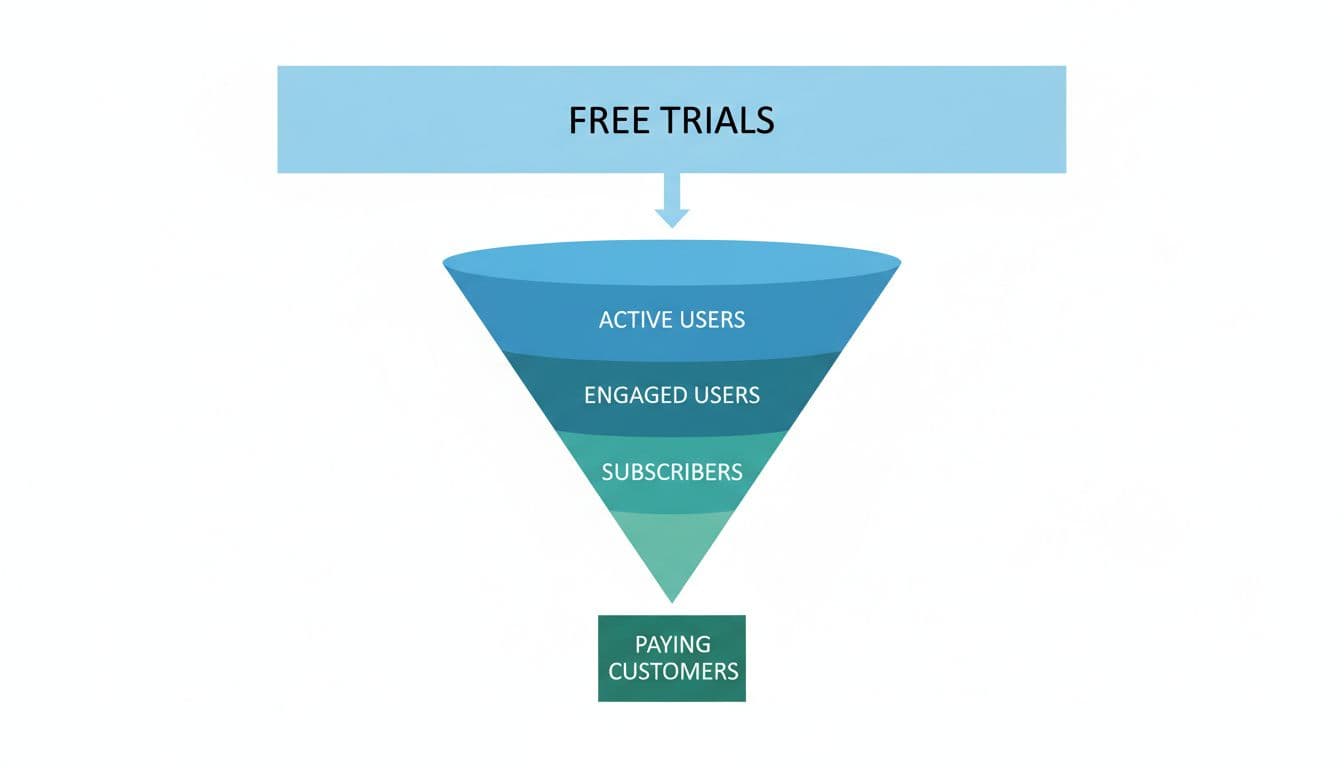
For me, this metric is the bridge between interest and income. It tells me whether trials are turning into paying customers, or slipping away like water through a cracked cup. Once I can see the pattern, I can act on it.
What trial conversion rate means in Baremetrics
When I track trial conversion rate in Baremetrics, I start with the simple definition. It’s the share of trial users who become paying customers.
Based on current Baremetrics product details, Trial Insights uses a 30-day rolling average for this metric. The formula is:
Converted trials in the past 30 days / New trials in the past 30 days × 100
So, if I had 100 new trials in the last 30 days and 22 converted, my trial conversion rate would be 22%.
That sounds simple, but there’s an important catch. A rolling average is great for trend watching, not perfect cohort analysis. If signups spike today, the rate may dip for a while because those new users haven’t had time to convert yet.
I treat Baremetrics trial conversion rate as a trend line, not a final verdict on one signup cohort.
That’s one reason I like Baremetrics’ own explanation of trial conversion rate metrics. It matches how I use the number in practice. I want a clean view of momentum, not a noisy daily chart that sends me into panic mode.
I also read this number beside trial volume. A 40% conversion rate from 10 trials is less useful than 20% from 500 trials, depending on pricing and sales effort. In other words, context matters. That’s why I rarely review this metric alone.
How I find and read it in Trial Insights
My workflow in Baremetrics is pretty direct, and it starts before I even open the dashboard.
First, I connect the billing source, often Stripe or another supported payment system, so trial and subscription data flow into Baremetrics. Next, I check that trial lengths are set correctly in plan management. If those settings are wrong, the reporting can drift off course.
Then I open Trial Insights and read the numbers in this order:
- Conversion rate, the 30-day rolling average
- New trials, to gauge top-of-funnel flow
- Active trials, to see current pipeline size
- Average trial length and Trial Value, to estimate timing and revenue potential
Baremetrics’ Trial Insights feature page shows the same core view: conversion rate, lead flow, trial value, and time left. That mix matters because it helps me avoid a narrow read. A healthy conversion rate with weak trial volume can still mean slow growth. On the other hand, rising trial value can justify more hands-on follow-up.
I also look at plan mix. If one pricing tier converts far better than another, that tells me something useful about fit, onboarding, or price. Baremetrics has shared updates on Trial Insights in its recent changelog. At the time of that update, plan comparison existed for new, converted, and canceled trials, while conversion rate comparison itself still had some limits. So, when I need more detail, I compare the pieces around the rate, not only the rate itself.
A simple weekly habit helps here. I review Trial Insights on the same day each week, then compare it with onboarding changes, pricing tests, and campaign shifts. That way, I’m not staring at a graph without a story.
How I turn the number into action
A trial conversion rate is only useful if it changes what I do next. I use it to spot friction inside the trial, then fix the first weak link.
For example, if new trials rise but conversions fall, I usually check lead quality and activation. Are the right people signing up? Are they reaching value fast enough? If Trial Value looks strong but conversions stay soft, I may have a follow-up problem rather than a product problem.
Baremetrics also gives me useful ways to focus my attention. I can group trials by likely value or time left, which helps sales and customer success teams spend time where it counts. A high-value trial with two days left is a warm lead, not a name on a chart.
The broader lesson is simple. I don’t chase the metric by itself. I use it with other SaaS health numbers, much like the SaaS metrics checklist for founders suggests.
A quick benchmark reality check
Benchmarks help, but I use them as guardrails, not scorecards.
| Trial type | Typical conversion range |
|---|---|
| Opt-in, no card required | 15% to 25% |
| Opt-out, card required | 50% to 60% |
| Freemium to paid | 2% to 5% |
| Enterprise or sales-assisted | 10% to 15% or higher |
The takeaway is plain: your model shapes the number. A no-card product should not expect the same rate as a card-required trial. Shorter trials can also push faster action, while activated users often convert far better than everyone else.
When the tracking looks wrong
When Baremetrics numbers seem off, I check three things first.
I verify the billing connection and recent sync activity. Then I review plan settings and trial lengths. After that, I compare new trials, converted trials, and raw subscription events to see where the mismatch starts.
I also watch for definition drift. A free plan is not always a trial. A user who skips the trial and pays on day one may land outside the trial view. If the team changed pricing, added annual plans, or switched trial rules, the chart can move for reasons that have nothing to do with onboarding quality.
For practical ideas on tying reporting to action, I like Baremetrics’ guide on using subscription reporting to improve trial conversion rate. It lines up with the same habit I use: check the number, find the cause, change one thing, and watch the trend.
A trial rate is more than a dashboard stat. It’s the sound of your signup engine either clicking into gear or grinding against friction.
When I track trial conversion rate in Baremetrics, I’m not chasing a pretty chart. I’m looking for the moment where interest turns into revenue.
If your rate feels murky today, start with Trial Insights, clean up your plan settings, and review the trend each week. Small fixes often move this metric more than big ideas do.


