I can learn a lot from one number, but only if I calculate it the same way every month. When I track Baremetrics subscription growth rate, I’m watching whether my subscriber base is growing faster than it leaks.
That matters because a busy acquisition month can hide weak retention. I want a number that tells me if the base is rising, holding steady, or slipping.
What subscription growth rate tells me
For me, subscription growth rate is a headcount view of the business. It measures how many active subscriptions I gained or lost over a period, compared with where I started.
That makes it different from MRR growth. Revenue can rise because of higher prices or upgrades, even if the number of subscriptions barely moves. The reverse can happen too. I might add many low-priced plans and still feel little lift in cash.
MetricHQ describes subscriber growth rate in the same plain way, as a percentage change in the account base over time, which matches how I think about it in practice. Subscriber Growth Rate definition
Here’s the simple version I keep in mind:
| Term | What it means |
|---|---|
| Starting subscriptions | The number of active subscriptions at the beginning of the period |
| New subscriptions | The subscriptions I added during the period |
| Churned subscriptions | The subscriptions I lost during the period |
If I start with 1,000 subscriptions, add 150, and lose 50, my net gain is 100. That means my subscription base grew by 10% for the period.
The formula I use in Baremetrics
The math is simple, and that is part of the appeal.
Subscription growth rate = ((New subscriptions – Churned subscriptions) / Starting subscriptions) x 100
I like to think of it as net change divided by the size of the base. That keeps the number honest. A gain of 100 subscriptions means one thing for a 500-account business and a very different thing for a 10,000-account business.
For a parallel definition, ChartMogul’s paid subscription growth rate uses the same basic month-over-month logic. That’s useful when I want to sanity-check my own math.
If I use the same example as above:
- Starting subscriptions: 1,000
- New subscriptions: 150
- Churned subscriptions: 50
- Net change: 100
- Growth rate: 100 / 1,000 x 100 = 10%
If the starting number is tiny, the percentage can look dramatic. I always check the raw counts first.
One small warning matters here. If the starting subscription count is zero, the formula breaks. In that case, I look at the first measurable base period instead of forcing a percentage that doesn’t mean anything.
Where I find the number in the dashboard
In Baremetrics, I look for the subscription and revenue views side by side. Product labels can shift a little across plans and releases, so I focus on the metric logic first, then the exact menu path.
I want three things on screen at the same time:
- The subscription trend for the period I care about.
- The churn or cancellation view that explains losses.
- The period comparison, so I can tell whether growth improved or stalled.
When I want a wider read on performance, I also compare the number with the metrics I use to catch churn. That keeps me from staring at one chart in isolation. A subscriber line can look fine while churn quietly drags the business backward.


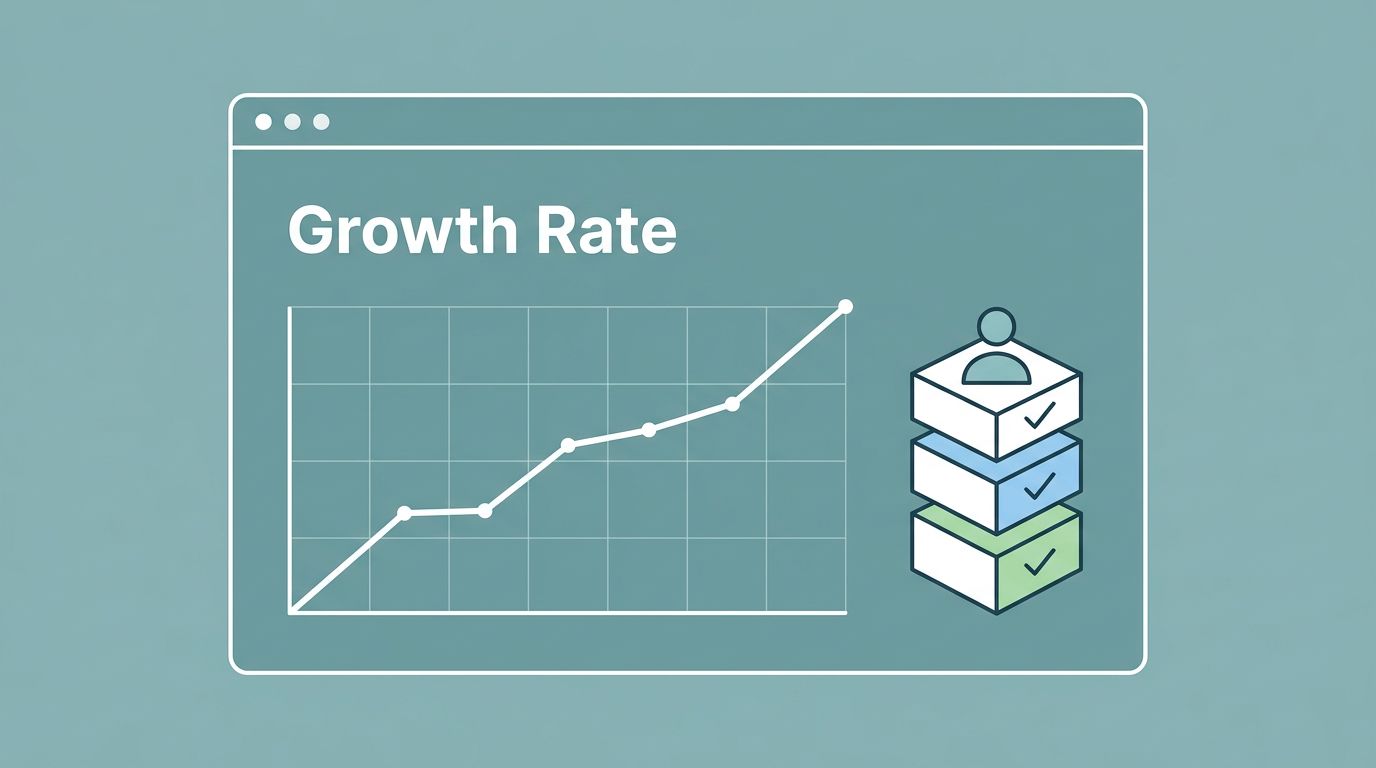
I like this view because it turns growth into a shape, not a guess. A steady climb feels different from a spike followed by a drop. The chart tells that story faster than a spreadsheet full of dates.
How I read the result month by month
A good percentage does not mean much by itself. I read it in context, then I decide what to inspect next.
| Growth rate | What I take from it | What I check next |
|---|---|---|
| 5% or more | The base is growing well | Acquisition quality, expansion paths, plan mix |
| 0% to 5% | Growth exists, but it feels thin | Trial conversion, churn by plan, activation flow |
| Below 0% | The base is shrinking | Cancellations, onboarding, pricing friction |
I treat those bands as signals, not rules. A seed-stage company and a mature SaaS business will not need the same pace. Still, a negative rate almost always deserves attention.
When the subscription count looks healthy but revenue feels flat, I pair the view with tracking net revenue retention for SaaS growth. That helps me see whether expansion is offsetting churn or whether I’m only replacing lost ground.
For planning, I push the trend into SaaS financial forecasting guide. A month of strong growth matters more when I can see how it changes next quarter’s revenue path.
Mistakes that make the rate lie
The math is simple, but the inputs can get messy fast.
- I avoid mixing subscriptions and revenue in the same calculation. One counts customers, the other counts dollars.
- I don’t compare uneven periods without noticing it. A 30-day month and a 31-day month can bend the result a little.
- I never ignore the starting base. A high percentage with a tiny base is noise, not a trend.
I also watch for plan changes. If I launch a new low-priced tier, the subscription count can jump while MRR barely moves. That is still useful, but it means I need a second metric before I celebrate.
Conclusion
When I calculate subscription growth rate in Baremetrics, I’m not chasing a vanity number. I’m checking whether the business is adding more subscriptions than it loses, and whether that pattern holds from one period to the next.
The clearest view comes from a simple formula, clean dashboard comparisons, and a habit of reading the result in context. That is the real value of Baremetrics subscription growth rate, it shows me if my growth has a solid floor or just a thin coat of paint.