MRR can look healthy while profit slips through the cracks. I see that happen when revenue grows faster than cost control.
To measure saas profit margin with Baremetrics, I start with revenue truth and then pair it with cost truth. Baremetrics helps me read the subscription story, while my accounting data tells me what survives after expenses.
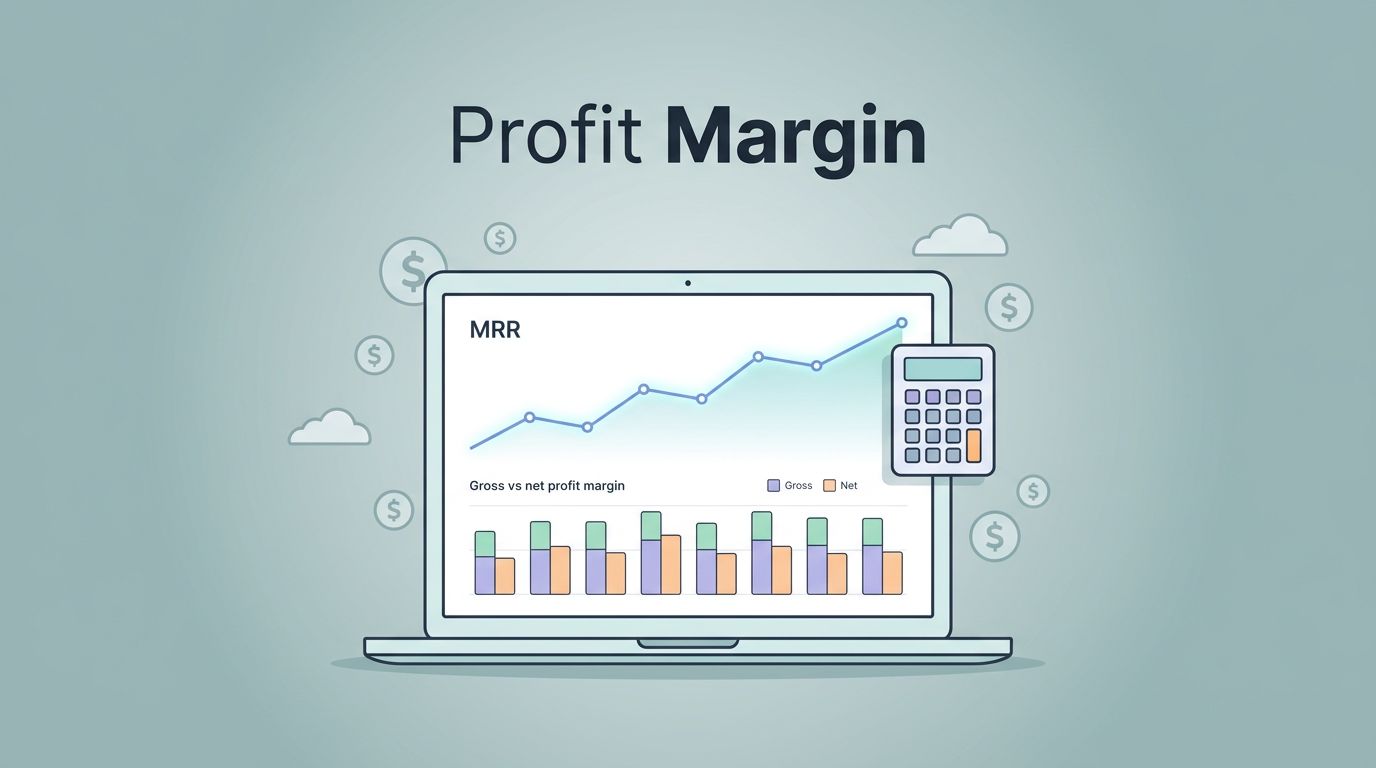
That split matters. Once I separate gross margin from net margin, I can see whether growth is actually helping the business.
Start with the margin definition that matters
I use one formula first: profit margin = profit / revenue x 100. In SaaS, I usually break that into two views. Gross margin shows what remains after direct product costs. Net margin shows what remains after every cost is paid.
For formula checks, I like cross-referencing my sheet with Cloudzero’s margin analysis guide. It keeps the math plain and prevents me from mixing product costs with overhead.
The cost buckets matter. Hosting, payment fees, infrastructure, and some support costs often sit near the product layer. Salaries, marketing, rent, taxes, and interest sit below that. I keep the classification consistent month to month, because a moving target makes the margin useless.
A simple example helps. If I bring in $100,000 in revenue and spend $22,000 on direct product costs, my gross margin is 78%. If total expenses reach $80,000, my net profit margin is 20%. Same company, two very different readings.
Gross margin tells me how efficiently the product runs. Net margin tells me how much of the business survives.


How I use Baremetrics to read the revenue side
Baremetrics is where I check the subscription heartbeat. I use Baremetrics metrics I use to catch churn to track MRR, ARR, churn, and expansion in one place. Those numbers don’t equal profit, but they explain why profit moved.
Here is the distinction I keep in front of me:
| Metric | What I watch | Why it matters |
|---|---|---|
| Profit margin | Profit as a share of revenue | Shows what the business keeps |
| Gross margin | Revenue after direct product costs | Shows product efficiency |
| Net margin | Revenue after all costs | Shows company-wide health |
| MRR | Monthly recurring revenue | Shows monthly subscription scale |
| ARR | Annual recurring revenue | Helps with planning and board views |
| CAC | Customer acquisition cost | Shows how expensive growth is |
| LTV | Customer lifetime value | Shows how much value a customer can create |
The table matters because each metric answers a different question. MRR and ARR tell me how much recurring revenue I have. CAC tells me what I paid for it. LTV tells me what that customer might return over time. Only profit margin tells me what remains after the full bill.
That is why I never treat MRR as a profit number. It is a top-line signal, not the finish line.
When I want to connect customer value to margin, I also use how I deploy a customer lifetime value calculator. It helps me see whether acquisition spend makes sense against the revenue a customer brings back.


My monthly workflow for calculating SaaS profit margin
I don’t ask Baremetrics to do accounting work. I use it to anchor the revenue side, then I combine that with a monthly cost sheet.
- I pull monthly recurring revenue, churn, and expansion figures from Baremetrics.
- I segment the data by plan, cohort, or customer type if the margin change needs context.
- I add direct costs from my accounting system, including product delivery costs and any recurring support expense I classify there.
- I add overhead, such as payroll, marketing, rent, and software, to get net profit.
- I calculate gross and net margin, then compare the result with the prior month.
That process keeps the math honest. If revenue rose but margin fell, I know cost growth outpaced it. If revenue flattened but margin improved, I know the business got tighter.
A quick example makes it clearer. Suppose monthly revenue is $90,000. Direct costs are $20,000, and all other operating costs bring the total to $75,000. Gross margin is 77.8%. Net margin is 16.7%. The company is profitable, but the gap between the two numbers tells me a lot about overhead.
For a second check on gross margin math, I compare my sheet with this practical SaaS gross margin calculation guide. When the result matches twice, I trust it more.
I also use adjusting LTV for SaaS profit margins when I want to see how retention and margin interact. That matters if acquisition spend looks good on paper but slow payback is draining cash.
What I change after I know the margin
Measurement only helps if it changes a decision. Once I know where margin is leaking, I look for the source before I cut anything.

I usually start with delivery costs, because they hit gross margin first. Hosting waste, bloated tooling, and heavy support load can all eat the product layer. If one plan tier creates most of the support burden, I study that tier before I touch pricing.
Then I look at pricing. Old SaaS plans often stay cheap long after the market moves. If a plan is underpriced and still attracts high-touch customers, the margin math will tell me before instinct does.
I also watch churn and failed payments. A small lift in retention can protect both revenue and margin because it lowers replacement pressure. That is where subscription metrics matter, since one lost customer often means more sales work just to stand still.
Here are the moves I use most often:
- I trim costs that scale with usage before I cut growth spend.
- I re-price plans that deliver strong value but weak margin.
- I reduce support load with better onboarding and clearer product flows.
- I compare CAC against LTV so I know which channels pay back cleanly.
When I want a deeper view of payback, I return to Baremetrics customer lifetime value calculations. Margin improves fastest when acquisition, retention, and delivery costs all move in the same direction.
Mistakes that make the numbers lie
The biggest mistake is treating MRR like profit. MRR is revenue momentum, not bottom-line gain. A second mistake is mixing gross costs with overhead, which blurs the gap between product efficiency and company efficiency.
I also avoid comparing monthly revenue to annual expenses without adjusting the timing. That distorts the result fast. Refunds, discounts, and plan mix matter too, because a high-volume low-margin tier can hide in the average.
If the numbers feel off, I step back and ask whether I’m measuring the business or just the billing system. That question usually finds the flaw.
My bottom-line takeaway
Baremetrics helps me see the subscription business clearly, but it doesn’t replace cost accounting. I use it to understand revenue movement, churn, and customer value, then I pair that with expenses to calculate margin.
When I track gross margin, net margin, CAC, and LTV together, I get a cleaner view of the business. A SaaS company can grow fast and still bleed cash, and the margin math shows me which side I’m really on.