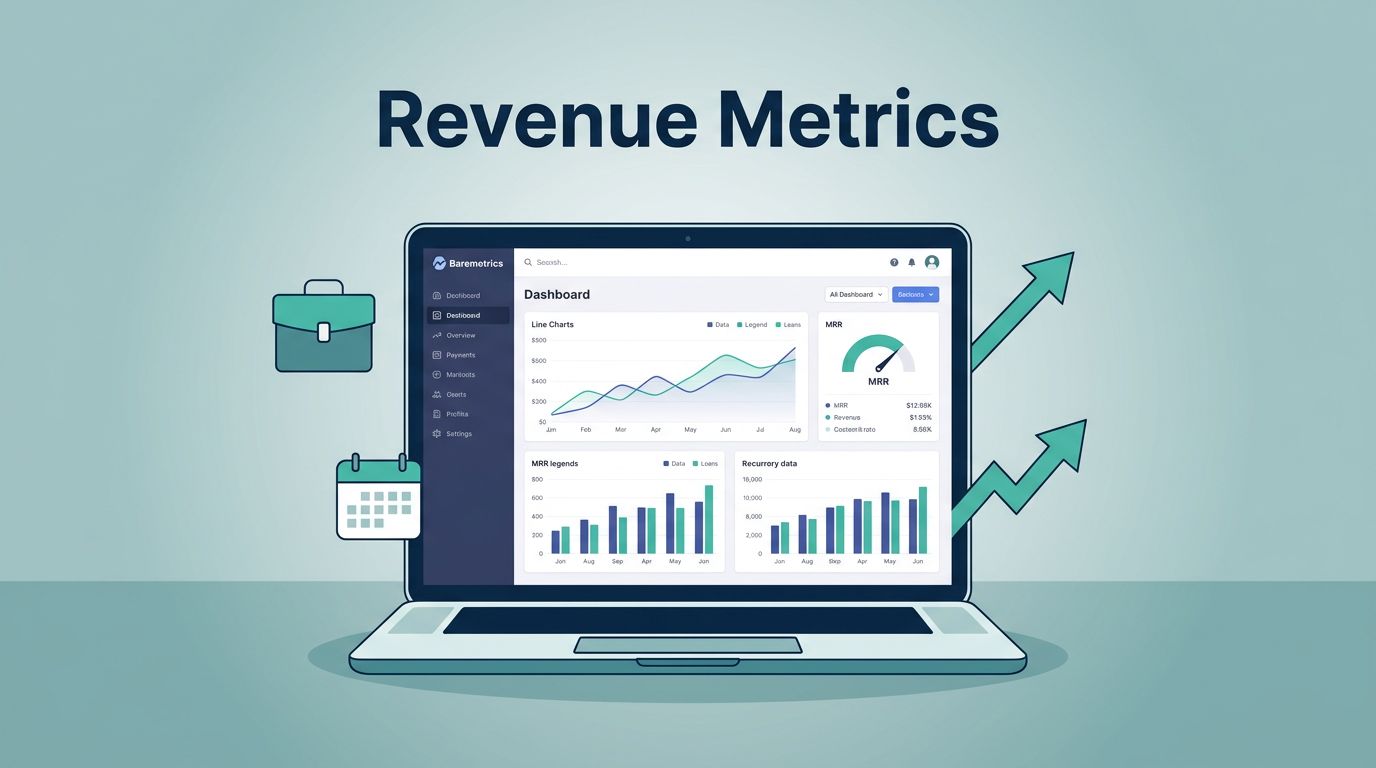
If your agency earns recurring retainers, one weak month can hide under a stack of invoices. I use Baremetrics subscription metrics to strip that noise down to a clear revenue picture, so I can see growth, leakage, and risk early.
For agencies, that matters because the billing story is rarely the full story. A few upgrades can cover a churn problem. A handful of downgrades can flatten the quarter before anyone feels it in Slack.
I start with the numbers that can change pricing, retention, or staffing. The rest stays in the background.
The metrics I watch first
When I look at Baremetrics, I do not try to track everything at once. I start with a small set that tells me where agency revenue comes from and where it slips away. I keep the metric names in plain English, because finance and client teams need the same picture.
| Metric | Plain meaning | Why I care for agencies |
|---|---|---|
| MRR | Recurring revenue collected each month | Shows whether retainers are growing or shrinking |
| ARR | Recurring revenue projected across a year | Helps when I sell annual contracts or long retainers |
| New MRR | Revenue from new clients | Tells me if acquisition is working |
| Expansion MRR | Extra revenue from upgrades or add-ons | Shows whether current clients are buying more |
| Contraction MRR | Revenue lost from downgrades | Warns me when packages no longer fit |
| Churned MRR | Revenue lost when clients leave | Reveals true client loss |
| ARPU | Average revenue per client | Helps me compare account quality |
| Failed payments | Charges that did not go through | Points to billing and collections issues |
This is the spine of tracking key Baremetrics SaaS metrics. I use it to separate growth from noise.
If a metric cannot change a choice, I keep it off the main view.
That rule keeps the dashboard useful. I do not want a wall of numbers. I want a short list that tells me where to act. For an agency, that usually means client retention, package fit, and revenue per account.
Build one dashboard for retainers, packages, and churn
I like starting with building a custom Baremetrics dashboard because agencies rarely sell one clean product. We sell retainers, support plans, audits, one-off launches, and add-ons. If I mix them together, the trend line turns muddy.


So I split revenue by billing interval, service line, and customer type. A monthly SEO retainer needs a different lens than an annual performance package. I also separate new-business revenue from expansion revenue, because those are different jobs. One tells me how well I sell. The other tells me how well I keep accounts growing.
That split matters when I review agency health. If monthly clients churn faster than annual clients, I know where pressure lives. If one service line has strong ARPU but weak expansion, I know the offer may be too narrow. If legacy packages keep contracting, I may need to rework scope or retire the old plan.
Baremetrics can also pull billing data from tools like Stripe, Chargebee, Recurly, Shopify, and app stores, which helps me keep one source of truth instead of five spreadsheets. For a recurring-service agency, that single view saves hours and cuts down on bad assumptions.
Turn revenue movement into decisions
I pair these views with subscription finance reporting with Baremetrics when I need a tighter executive view. The goal is simple, I want each metric to point toward a decision, not a report that gets filed away.
When MRR rises but churn rises too
More MRR can hide risk. If new sales are strong but churn accelerates, I look at onboarding gaps, weak delivery, or promises that stretched too far. For agencies, that often means the sale was fine, but the package was too broad.
I use that signal to tighten the offer, improve the first 30 days, or adjust account handoff. If the team keeps losing clients in the same band, the issue is usually not random. It is a pricing or delivery mismatch.
When expansion beats new sales
If expansion MRR climbs while new MRR stalls, I know current clients are still buying. That can be healthy, but only if downgrades stay low. Strong expansion means upsell paths are working, whether that is strategy hours, reporting add-ons, or higher-touch support.
I use that pattern to test higher-value packages and annual upgrades. If expansion is strong in one segment and weak in another, I revisit pricing and scope in the weak segment. Sometimes the market is fine. The package is the problem.
When failed payments and cancellations appear
Failed payments usually need a process fix, not a strategy memo. I watch them because they can snowball into avoidable churn. If Baremetrics shows more failed charges, I tighten payment reminders and check the billing sequence.
Cancellation reasons matter just as much. If clients keep saying “too expensive” or “missing features,” I have a package problem. If they say they no longer need the service, I may have sold a short-term need as a long-term retainer. That is useful feedback, even when it stings.
When the forecast goes flat
Forecasting matters when I need to decide whether to hire, pause spend, or push annual plans. If Baremetrics shows slower future revenue, I do not wait for the quarter to surprise me. I look at pipeline, retention, and upgrade motion together.
That view helps me decide whether the agency needs more new business or more account growth. It also tells me when I should stop assuming next month will fix this month.
Set up Baremetrics so the data stays trustworthy
If the source data is messy, the dashboard becomes theater. I start by connecting the billing platform that actually holds the money trail. Baremetrics supports data sources such as Stripe, Chargebee, Recurly, Shopify, and app stores, so I can usually bring recurring revenue into one place without stitching spreadsheets together.
I set it up in a simple order:
- I confirm the plan names match the way my agency sells.
- I split recurring work into clear buckets, such as retainers, support, add-ons, and annual commitments.
- I build segments for client type, service line, and billing cycle.
- I set a weekly review rhythm and route alerts to the people who act on them.
That setup keeps the dashboard honest. It also makes comparisons easier. A monthly social media retainer, for example, should not sit in the same bucket as an annual growth advisory contract.
The quick guide to getting started with Baremetrics is useful when I want the first connection steps in one place. If I need custom reporting work, I open the Baremetrics API quick start and check whether I can pull the data I need without manual exports.
I revisit the setup monthly. Service names change. Billing rules change. Client mix changes. The dashboard should keep up.
Conclusion
Recurring revenue can look healthy while it leaks in small pieces. That is why I like Baremetrics for agencies, it gives me one clean place to watch MRR, churn, expansion, and failed payments without guessing at the story behind them.
When I read the numbers with clear segments and simple definitions, I can make better choices about pricing, retention, and hiring. I can also tell the difference between real growth and a short-lived spike.
That matters more than a pretty chart. A good dashboard tells me where the agency is strong, where it is slipping, and what to do next.