Configuring a Reliable Conversion Funnel in Mida.so
A funnel can lose half its users between two clicks, and a top-line conversion rate won’t tell you why. Conversion funnel testing with Mida.so helps you locate the exact step where users stop, compare behavior across segments, and tur...

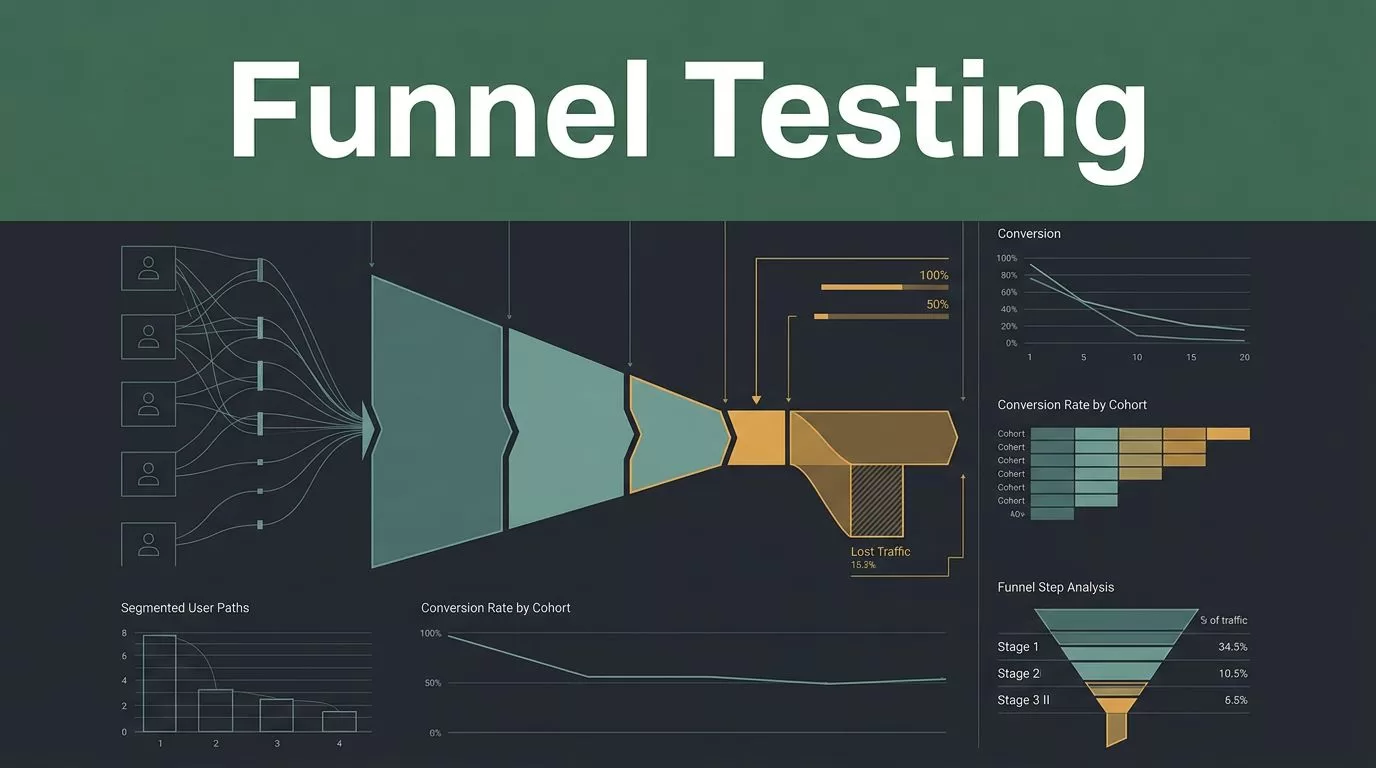
A funnel can lose half its users between two clicks, and a top-line conversion rate won’t tell you why. Conversion funnel testing with Mida.so helps you locate the exact step where users stop, compare behavior across segments, and turn drop-offs into testable changes.
The tool shows what users did. Your team still needs to define the question, configure reliable events, and judge results without treating every percentage change as proof. Start with a clean funnel and the rest becomes easier to manage.
Key Takeaways
- Mida.so connects user actions into funnel steps so you can measure progression and drop-off.
- Event names and properties must match the actions you want to analyze.
- Use recordings, heatmaps, and segments to investigate why a step underperforms.
- Treat early results as directional when traffic or conversions are limited.
- Retest important changes against the same audience, date range, and conversion definition.
Start With One Funnel Question
Don’t begin by tracking every action on your website. Start with one business question that has a clear outcome.
For a SaaS product, the question could be: “Where do new users abandon the path from signup to first project?” For an ecommerce store, it could be: “Which checkout step loses mobile visitors before payment?”
A useful funnel has a defined start, a small number of meaningful steps, and one final conversion. Mida’s funnel analysis is most useful when each step reflects a real user decision.
A typical SaaS activation funnel might look like this:
- User completes account signup.
- User creates a workspace.
- User invites a teammate.
- User creates a project.
- User returns within seven days.
The final step may be a retention event rather than a simple page visit. That difference matters. A visitor who reaches a confirmation page isn’t always a customer who receives value.
Use Mida’s product analytics platform to connect those actions and review how users move through the path. Keep the first version narrow. Five clear steps are easier to interpret than fifteen loosely related events.
Choose Events That Represent Intent
Pageviews are useful for traffic analysis, but they often provide weak funnel signals. Button clicks, form submissions, account creation, payment completion, and feature usage usually show stronger intent.
Name events around actions rather than interface details. “Signup completed” is more useful than “Blue button clicked.” The first name can survive a design change. The second may become inaccurate after a small UI update.
Keep naming consistent across your tracking setup. Google Analytics provides event naming guidance that also applies to broader product analytics work. Use a predictable structure for actions, objects, and properties.
Properties add context without creating separate events for every variation. For example, one checkout_started event can include device type, plan, currency, traffic source, and checkout version.
Before testing a funnel, confirm that the events fire once, fire at the correct time, and contain the expected properties. A tracking error can look like user friction.
Configure a Reliable Funnel in Mida.so
After defining the question, build the funnel around the event sequence. The exact interface can change, but the analysis logic stays the same.
Create the funnel with the earliest meaningful action as the entry point. Then add each required action in order. If users can complete the journey through different routes, decide whether the funnel should measure one route or the full conversion path.
Use a consistent date range when comparing results. A weekly report can show a sudden problem, while a 30-day view can show whether the issue is persistent. Avoid comparing a high-traffic weekday period with a holiday weekend unless that difference is part of the question.
Next, apply a relevant segment. Common segments include:
- New versus returning users
- Mobile versus desktop visitors
- Free versus paid accounts
- Campaign or referral source
- Country, browser, or device type
Don’t combine too many segments at the start. If you split a small dataset into six audiences, the resulting percentages may become unstable and difficult to act on.
A funnel report should answer three basic questions:
- How many users entered?
- How many reached each next step?
- What percentage continued or dropped at each stage?
Track both step conversion and overall conversion. Step conversion measures movement between two adjacent actions. Overall conversion measures movement from the first event to the final event.
Suppose 10,000 users view a pricing page, 1,000 start signup, and 300 complete it. The pricing-to-signup rate is 10%. The signup completion rate is 30%. The overall view-to-signup-completion rate is 3%.
Each number points to a different problem. The first may relate to positioning or pricing-page clarity. The second may relate to form length, trust, or technical errors.
Diagnose Drop-Off With Behavior Data
A funnel tells you where users stop. It doesn’t tell you whether they were confused, blocked, distracted, or simply not ready.
Use Mida’s supporting behavior reports to investigate the weak step. Session recordings can show repeated hesitation, rage clicks, form errors, and abandoned interactions. Heatmaps can show whether users see the relevant content and whether clicks concentrate on non-clickable elements.
Review a sample of sessions from both converters and non-converters. Look for repeated patterns, not one unusual visit. If several users reach a form and leave after an error appears, you have a stronger hypothesis than “the form feels difficult.”
The same method works for product funnels. Watch sessions where users complete an activation event, then compare them with sessions that stop one step earlier. The difference may be a missing permission, an unclear empty state, or a required setup task that appears too late.
Use the funnel report to rank investigation areas. A step with a large drop-off and high business value deserves attention before a minor page with a lower volume.
| Funnel signal | What it may indicate | Next check |
|---|---|---|
| Large drop between adjacent steps | Friction, confusion, or a broken flow | Recordings, errors, form behavior |
| Strong desktop rate, weak mobile rate | Responsive or performance issue | Mobile sessions and device breakdown |
| High entry volume, low intent | Message or audience mismatch | Traffic source and landing page |
| Sudden drop after a release | Tracking or product regression | Event firing and release timeline |
| Good step rates, weak final conversion | Value or trust problem later in the journey | Pricing, payment, or confirmation behavior |
The report doesn’t prove the cause. It narrows the search area so your team can inspect evidence instead of guessing.
A drop-off is an observation. A hypothesis explains it. A test checks whether the explanation holds.
Turn Funnel Findings Into Testable Hypotheses
A useful hypothesis connects a user problem to one change and one measurable outcome. Avoid broad statements such as “improve the signup page.” They don’t tell the team what to change or how to judge it.
Use this structure:
When [audience] reaches [step], [observed problem] may prevent [desired action]. Changing [specific element] should improve [metric].
Here are practical examples:
- When mobile visitors reach signup, a long form may create unnecessary effort. Removing optional fields should improve signup completion.
- When trial users create a workspace, unclear setup instructions may delay the first project. Adding a guided setup step should improve project creation.
- When shoppers review shipping costs, late fee disclosure may cause checkout abandonment. Showing the total cost earlier should improve payment completion.
- When users reach a demo form, unclear response timing may reduce submissions. Adding a specific reply expectation should improve qualified demo requests.
Define the primary metric before launching a change. If the test targets signup, use completed signups as the main outcome. Monitor secondary metrics such as activation, paid conversion, revenue, support requests, or refund rate.
A higher first-step conversion isn’t automatically a win. A shorter form may increase signups while reducing qualified accounts. A stronger checkout button may increase payment starts while leaving completed purchases unchanged.
Set the analysis window before you inspect the result. Choose a period that captures normal traffic and account for weekly patterns. Record the audience definition, funnel steps, variant exposure, and event version.
Mida can measure the behavior associated with a variant when your experiment tool or implementation passes that variant as a property. It shouldn’t be treated as the system that randomly assigns users unless your setup explicitly provides that function. Use an experimentation platform or controlled release process for assignment, then use Mida to analyze the resulting behavior.
Interpret Results Without Overstating Certainty
Conversion funnel testing produces numbers, but numbers need context. A 20% relative lift can come from a small change in the numerator. If conversions rise from 5 to 6, the direction is positive, but the evidence is weak.
Check the absolute conversion counts, not only the percentage. Review the same audience and the same event definition. Look for tracking gaps, uneven traffic allocation, bot activity, and changes in campaign mix.
Statistical significance can help assess whether a difference may be random, but it doesn’t fix poor experiment design. A result can be statistically convincing and still have little business value. A small dataset can show a large apparent lift that disappears with more traffic.
Use statistical significance guidance from Optimizely when your team needs a formal framework. Treat Mida’s funnel result as evidence within the wider experiment analysis, not as an automatic verdict.
Separate results into three practical categories:
- Clear improvement: The primary metric improves, the sample is adequate, and important secondary metrics remain healthy.
- No reliable difference: The observed change is small or uncertain. Keep the original version unless another reason supports the change.
- Mixed outcome: One step improves while a later business metric declines. Investigate the full funnel before choosing a winner.
Don’t stop a test because the first day looks strong. Early traffic is noisy, and the users who arrive first may not match the normal audience. Don’t keep a weak variation running forever either. Set a decision rule before the test starts.
Build a Repeatable Mida.so Testing Process
Run funnel analysis on a fixed schedule. A weekly review works for active acquisition funnels. A monthly review may suit lower-volume B2B products.
Start each review with the same dashboard and date range. Check total entries, step conversion, overall conversion, segment differences, and changes since the previous period. Then review recordings or heatmaps for the largest practical issue.
Maintain a simple test log outside the analytics tool. Record the hypothesis, start date, audience, change, primary metric, result, and decision. Include tracking changes because an event update can create a false before-and-after comparison.
Prioritize tests with a basic score:
Impact x traffic x confidence
Impact estimates the value of fixing the problem. Traffic shows how many users can be affected. Confidence reflects the quality of the evidence from funnel data and user behavior.
A high-traffic signup problem usually outranks a low-volume settings-page issue. A small but severe payment error may outrank both because it affects direct revenue.
After each test, update the funnel definition if the product flow changed. Remove obsolete events. Document new properties. Review whether the original conversion still represents customer value.
Conclusion
Mida.so makes conversion funnel testing practical when your events match the user journey and your analysis stays focused. Use funnels to locate the drop-off, recordings and heatmaps to inspect behavior, and controlled tests to evaluate the change.
Don’t treat a percentage lift as a final answer. Check conversion counts, segment quality, downstream outcomes, and tracking accuracy. The strongest funnel program is not the one with the most tests. It’s the one that turns reliable behavior data into better product decisions.

