Improving LCP and Core Web Vitals With Mida.so Journey Data
A slow page can lose a visitor before your offer appears. The problem is often hidden behind average load times, because different users experience the same page in different ways. Web performance metrics give you the evidence. Mida.so help...

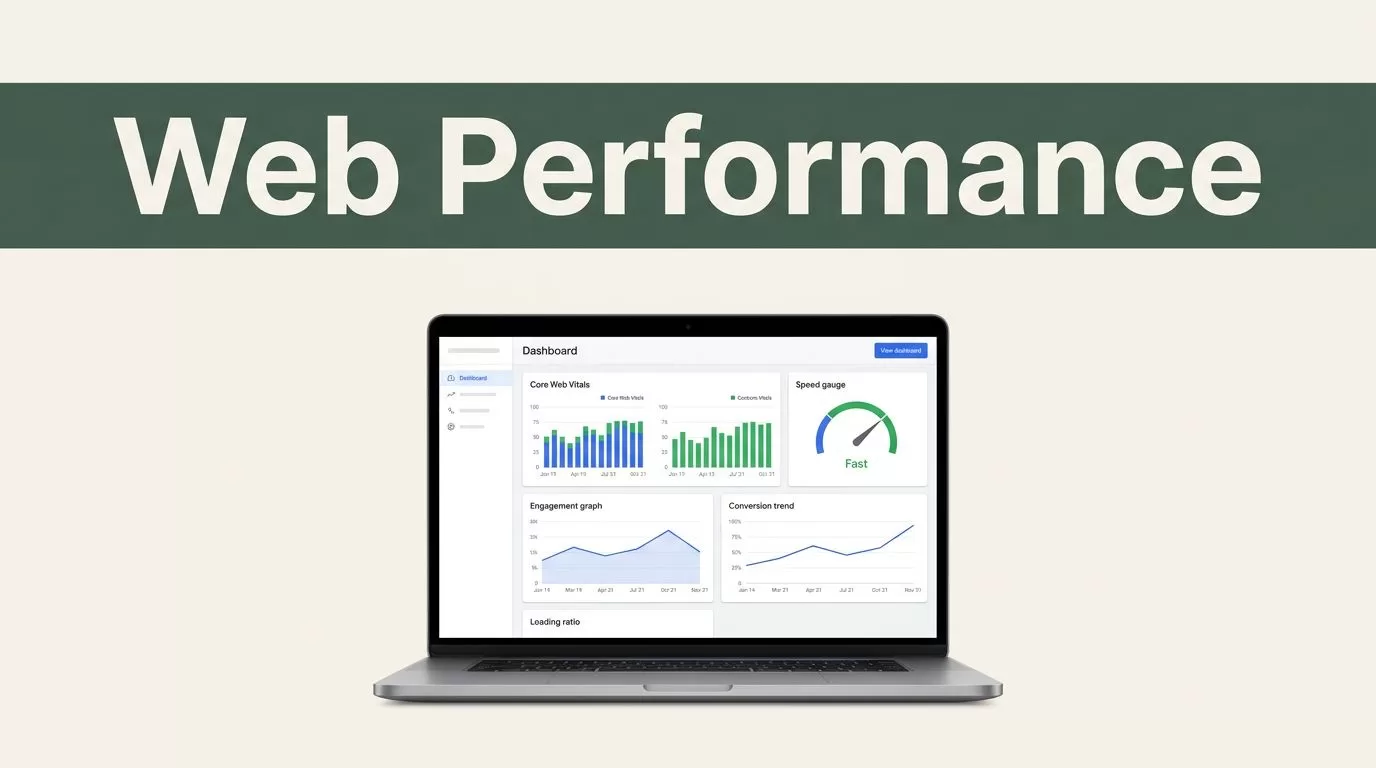
A slow page can lose a visitor before your offer appears. The problem is often hidden behind average load times, because different users experience the same page in different ways.
Web performance metrics give you the evidence. Mida.so helps connect that evidence with user behavior, engagement, and conversion activity. You can identify which pages need attention, find the affected audience segments, and measure whether each fix improves business results.
The process starts with the right metrics and a clean measurement setup.
Key Takeaways
- Core Web Vitals focus on loading, responsiveness, and visual stability.
- Lab tests help diagnose problems, while field data shows what real visitors experience.
- Mida.so connects performance trends with behavior and conversion data.
- Fix high-impact templates and user journeys before low-value pages.
- Measure after every major change, then compare results by device, browser, and traffic source.
Start With the Metrics That Affect User Experience
Web performance has many measurements. You don’t need to track every number at the same time. Start with the metrics that describe what visitors see and feel.
Google’s current Core Web Vitals guidance focuses on three measurements:
- Largest Contentful Paint (LCP) measures how quickly the main content becomes visible. A good result is 2.5 seconds or less.
- Interaction to Next Paint (INP) measures how quickly a page responds to user actions across the visit. A good result is 200 milliseconds or less.
- Cumulative Layout Shift (CLS) measures unexpected movement on the page. A good result is 0.1 or less.
These metrics cover three basic questions. Did the page load its main content quickly? Did it respond when the visitor interacted? Did the layout stay in place?
Other measurements still matter. Time to First Byte (TTFB) shows how quickly the server starts responding. First Contentful Paint (FCP) shows when the first visible content appears. They aren’t Core Web Vitals, but they often help explain a poor LCP result.
A page can have a strong average load time and still perform badly for mobile users on slower networks. That is why averages aren’t enough. Review the percentage of visits in the good, needs-improvement, and poor ranges.
Performance also affects business outcomes. A delayed product page can reduce scroll depth. A slow checkout interaction can increase abandonment. A layout shift can cause a visitor to click the wrong button.
Google treats Core Web Vitals as part of its page experience signals, but passing them doesn’t guarantee high rankings. The Google Search documentation on Core Web Vitals makes the position clear: performance supports search quality, but relevance and other ranking factors still matter.
Separate Lab Data From Real User Data
You need two types of performance data. Each answers a different question.
Lab data comes from a controlled test. Tools such as Lighthouse and PageSpeed Insights load a page under defined conditions. You can change the device profile, network speed, and test location. Lab tests are useful during development because they return quickly and expose likely causes.
Lab results are diagnostic. They help you inspect render-blocking resources, image sizes, JavaScript execution, and layout behavior. A developer can make a change, run the test again, and compare the result.
Field data comes from real visitors. It includes differences in devices, browsers, network conditions, locations, and user behavior. Field data tells you what your audience experiences after the page is deployed.
Chrome’s Chrome UX Report documentation describes a public dataset based on real user experiences. CrUX data uses a rolling collection period, so it doesn’t react instantly to a code change. That delay is normal.
Mida.so belongs in the operating layer around this data. Use it to connect performance observations with page views, sessions, events, and conversions. A report that says “mobile LCP is poor” is useful. A report that says “mobile visitors from paid search abandon the pricing page more often after a slow load” is more useful.
Lab data helps you find the cause. Field data tells you whether the fix works for real visitors.
Don’t compare a Lighthouse score directly with a field score. The tests use different conditions and answer different questions. Use lab data to debug. Use field data and Mida.so behavior data to prioritize and validate.
Configure Mida.so Around Business-Critical Journeys
A performance dashboard becomes useful when it follows the path your business depends on. Start with your highest-value pages and actions.
Create a measurement plan for:
- Landing pages that receive paid or organic traffic.
- Product, pricing, and comparison pages.
- Signup, demo request, and checkout flows.
- Search, filters, menus, and other interactive elements.
- Confirmation pages that prove a conversion occurred.
Connect these page groups to the events you already use. Examples include form starts, form completions, add-to-cart actions, checkout steps, account creation, and demo bookings.
Mida.so can then help you compare behavior across performance conditions. Look for differences in engagement, conversion rate, exit rate, and interaction depth. Keep the analysis practical. You don’t need a long list of dashboard widgets. You need a clear relationship between a slow experience and a business action.
Segment the results by device type, browser, operating system, traffic source, geography, and page template. These segments often reveal problems hidden by a site-wide average.
For example, desktop visitors may receive a fast experience while mobile visitors wait for a large hero image. A single average hides the difference. A device segment exposes it.
Traffic source matters too. Visitors from a paid campaign may land on a page with heavy tracking scripts and embedded content. Organic visitors may use a different template. Compare like with like before changing the page.
Mida.so should help you answer operational questions:
- Which templates have the weakest performance?
- Which audience segments experience the delay?
- Which conversion events drop on those pages?
- Did the latest release improve the result?
- Is the problem isolated to one browser or spread across the site?
Keep event names consistent. Use one naming structure for page views, forms, purchases, and key interactions. Inconsistent events create unreliable comparisons and waste analysis time.
Fix the Largest Causes First
Once you find a problem page, work through the cause in order. Avoid random changes based on a single score.
Improve LCP by Controlling the Main Content
A poor LCP result often comes from a large hero image, slow server response, client-side rendering, or a font that blocks the main content.
Start with the page’s largest visible element. Compress the image without damaging its purpose. Use an appropriately sized responsive image. Preload the primary image only when it is part of the initial viewport. Don’t preload every image on the page.
Move below-the-fold media out of the critical loading path. Use lazy loading for content that visitors won’t see immediately. Review third-party scripts that load before the main content.
Server response also matters. Check caching, database queries, redirects, and hosting capacity. A browser can’t render the page until it receives enough HTML and resources.
Use LCP optimization guidance from web.dev when you need to trace the metric through request timing, resource delivery, and rendering.
Improve INP by Reducing Interaction Work
INP often suffers when JavaScript keeps the main thread busy. The browser can’t respond promptly while it is parsing scripts, recalculating styles, or running long tasks.
Review the interactions that matter most. Test navigation menus, filters, search fields, product selectors, and form controls. Break large JavaScript tasks into smaller tasks. Delay non-essential scripts until after the first interaction or after the main content is ready.
Remove unused code where possible. Reduce the work triggered by each click. Avoid updating large sections of the page when only one small component changes.
The web.dev guide to improving INP covers long tasks, event handlers, rendering work, and common causes of slow response.
Improve CLS by Reserving Space
Layout shifts happen when content appears without reserved space. Images, ads, banners, embedded videos, and late-loading fonts are common causes.
Set width and height attributes for images and video. Reserve space for promotional bars before they load. Keep buttons and links in stable positions. Avoid inserting content above an existing paragraph after the page becomes visible.
Track CLS on the page types where visitors make decisions. A small shift on a long article is frustrating. A shift that moves a purchase button can cause an incorrect click or a lost conversion.
Turn Performance Work Into a Repeatable Process
Performance improvements work better when you treat them as an ongoing operating process, not a one-time cleanup.
Set a baseline before making changes. Record the current Core Web Vitals, conversion rate, and important engagement events for each priority template. Include the date, release version, device split, and traffic source.
Then make one meaningful change at a time. If you compress images, remove a script, change caching, and rebuild the layout together, you won’t know which change produced the result.
Use this cycle:
- Identify a page or segment with a performance problem.
- Confirm the problem with lab and field data.
- Find the likely technical cause.
- Apply one controlled fix.
- Check user behavior and conversion events in Mida.so.
- Compare the new result with the baseline.
Don’t expect field data to update immediately. Allow enough traffic and time for a useful sample. Check for seasonal changes, campaign changes, and release changes before assigning credit to performance work.
A useful performance report should show more than a score. Include the affected page, metric, device segment, likely cause, business event, owner, and next action. This gives developers and marketers a shared work queue.
Avoid Common Measurement Mistakes
The first mistake is chasing a perfect score on low-traffic pages. Prioritize pages that receive visitors and support revenue.
The second mistake is treating every slow page as a code problem. Poor performance can come from hosting, content size, third-party tools, tags, fonts, or a campaign landing page with unusual assets.
The third mistake is relying on one test. Lab data can look strong while real mobile visitors struggle. Field data can show a problem without identifying the exact script or resource responsible. Use both.
The fourth mistake is changing a page without tracking the outcome. If you don’t connect the release to user behavior, you can’t prove whether the work helped.
Mida.so isn’t a replacement for browser diagnostics, server monitoring, or developer tools. Use it to connect the technical result with the user and business result. That connection determines what deserves attention first.
Conclusion
Web performance metrics become useful when they lead to a clear decision. Track LCP, INP, and CLS, separate lab results from real-user data, and connect performance changes to conversions.
Use Mida.so to see which pages and audience segments carry the largest cost. Fix the highest-impact cause, measure the release, and keep the baseline. A faster score is helpful, but a faster experience that improves completed actions is the result your team needs.

