You run a SaaS business. Churn hits your MRR hard each month. Then a few old customers return. Those reactivated customers boost revenue, but only if you count them right.
I learned this the hard way. Early on, I mixed up pauses and true comebacks. My metrics looked off. Baremetrics fixed that. It spots reactivations precisely so I see real growth.
Now I share my process. You will learn to define them, spot billing triggers, and monitor in Baremetrics. This keeps your churn and MRR reports honest.
What Reactivated Customers Mean in Subscriptions
Reactivated customers are those who canceled their paid subscription but started a new one later. They do not just resume a paused plan. Baremetrics counts them when a fresh subscription links to a past canceled account.
Think of it like this. A user pays $50 monthly, cancels in April, then signs up again in July at $60. That $60 enters as reactivation revenue. It pads your MRR without inflating new customer counts.
Why does this matter? It shows winback success. Poor tracking hides if campaigns work. I check Baremetrics definitions to stay sharp. For details, see the Baremetrics Help Center on reactivations.

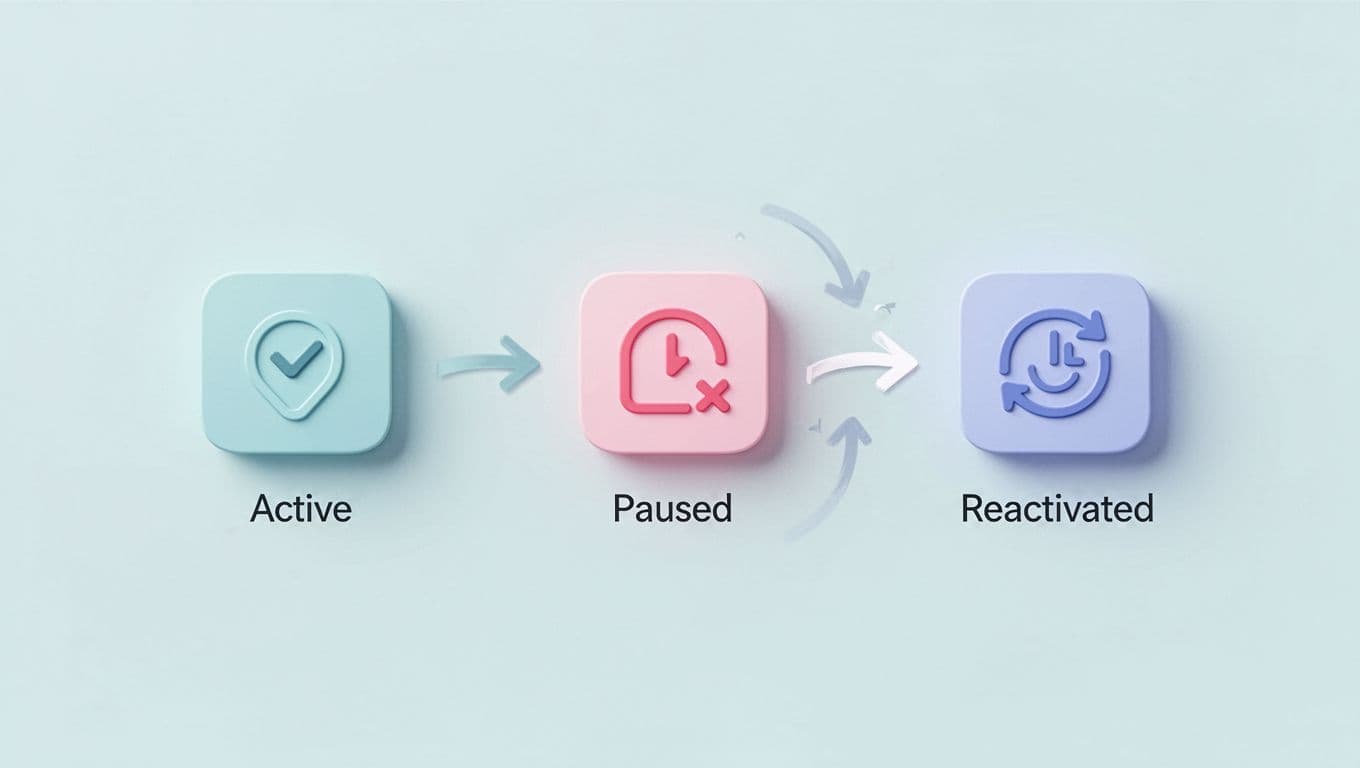
This flow matches what I see daily. Paused users stay “active” in some tools. Canceled ones can return as reactivated. Baremetrics draws a clear line.
I segment them too. Some return at higher tiers. Others downgrade. This data guides my retention tweaks.
Billing Scenarios That Count as Reactivations
Not every comeback qualifies. Common mix-ups come from billing quirks. I review these to avoid errors.
First, trial upgrades do not count. A user ends trial and pays? That’s new revenue. Baremetrics tags it as such.
Second, paused resumptions stay separate. Users hit pause, then resume. No cancellation happened. Revenue flows steady, no reactivation spike.
Third, full cancellations followed by new signups trigger it. User cancels paid plan, leaves for months, then rejoins. Baremetrics links the accounts and flags reactivation MRR.
Here is a quick table of scenarios I check:
| Scenario | Prior Status | Action | Counts as Reactivation? |
|---|---|---|---|
| Trial to paid | Trial | Upgrade | No, new customer |
| Paused plan | Paused | Resume | No, continuous |
| Canceled paid | Canceled | New signup | Yes, reactivation |
This setup prevents double-counting. I cross-check processor logs monthly. For example, Stripe dunning recoveries sometimes mimic reactivations. Baremetrics filters those out.


Visuals like this help my team grasp it fast. One wrong tag skews churn by 5%. Accurate billing ties directly to reliable metrics.
How Baremetrics Spots Reactivated Customers Automatically
Baremetrics pulls from your payment processor like Stripe or Paddle. It scans customer IDs across events. A match between old canceled and new paid subscription flags reactivation.
I connect once, then it backfills history. As of May 2026, this covers the full journey: first payment, cancel, return. No manual tagging needed.
Key spots to find them:
- Revenue breakout charts split MRR into new, expansion, reactivation, churn.
- Dedicated reactivations dashboard shows counts and trends.
- Customer profiles note prior status.
For instance, I filter by plan. Reactivated annual users often stick longer than monthly ones. This insight beats generic reports.
Baremetrics also tracks related events. Failed charges, refunds, upgrades all context the comeback. I learned this from their metrics overview.
Accuracy hinges on clean data. Duplicate emails or bad IDs confuse it. I audit imports quarterly.
Step-by-Step Monitoring in the Baremetrics Dashboard
I start my week on the dashboard. Reactivation metrics sit front and center.
First, open revenue trends. Spot reactivation MRR as a green line against churn red. If it rises, winbacks pay off.
Second, drill into customers tab. Filter “reactivated” status. Check average tenure before cancel. Short gaps mean quick regrets; long ones signal campaigns.
Third, segment by cohort. Compare reactivated to new users on ARPU. Reactivated often spend more because they know value.

My setup looks like this. Coffee helps long sessions. Next, export to Sheets for custom blends. Baremetrics API pulls fresh data.
Finally, set alerts. Drops below 10% of churn trigger reviews. This caught a weak email flow last quarter.
For dashboard tips, I use Baremetrics dashboard setups for MRR and churn. It matches my flow.
Linking Reactivations to MRR, Churn, and Lifecycle
Reactivations do not stand alone. They offset churn in net MRR. One $200 reactivation cancels two $100 churns.
I watch NRR closely. Reactivations lift it above 100%. Baremetrics calculates from expansion minus churn, including these returns. Check NRR tracking in Baremetrics for my monthly routine.
Churn looks lower too. Revenue churn divides lost MRR by starting MRR. Reactivations rebuild the base, so rates stabilize.
In lifecycle reports, they mark recovery phases. I compare LTV: reactivated users hit 1.5x new ones sometimes. Why? Proven fit.
Pair with Baremetrics metrics for churn protection. It breaks MRR by reactivation versus new.
Tools like Cancellation Insights feed this. Reasons for leave predict return odds. I target “too expensive” with discounts.
Conclusion
Accurate reactivation tracking turns churn data into action. Baremetrics delivers it without guesswork. I now trust my MRR growth.
Focus on clean billing links and dashboard habits. Your reports sharpen. Revenue holds steady.
Reactivated customers prove retention wins. Track them right, and watch NRR climb.