How to Track Real-Time A/B Testing Data in Mida.so
A live A/B test can show a clear winner before the test is ready to stop. That is why real-time A/B testing needs two separate habits: monitor the dashboard often, but make decisions only after the data reaches a useful level. Mida.so gives...
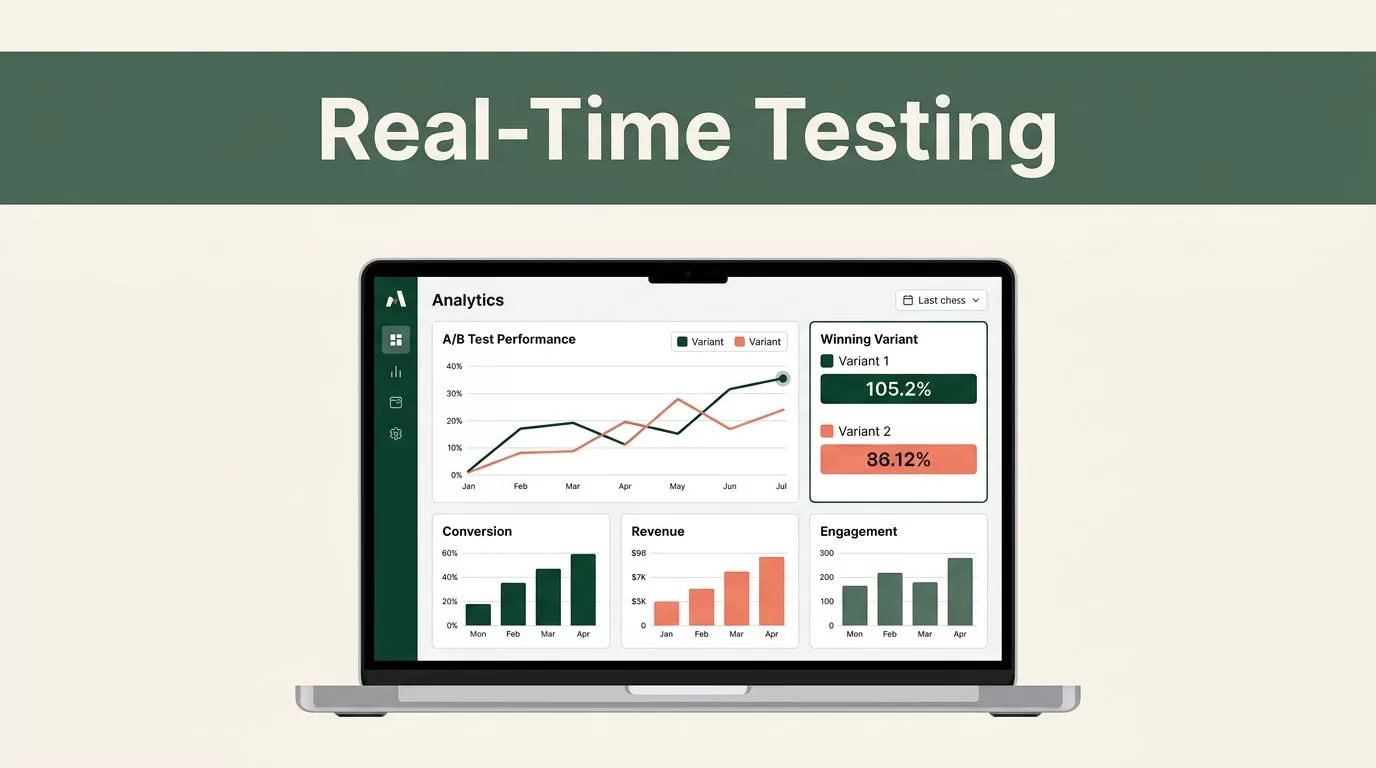
A live A/B test can show a clear winner before the test is ready to stop. That is why real-time A/B testing needs two separate habits: monitor the dashboard often, but make decisions only after the data reaches a useful level.
Mida.so gives you a central view of experiment performance, including conversion, revenue, and engagement results. The quality of those results depends on how you configure the test and how carefully you interpret early movement.
Key Takeaways
- Set one primary goal before launching an experiment in Mida.so.
- Use real-time dashboards to spot tracking issues and performance changes.
- Wait for sufficient sample size, test duration, and statistical confidence before declaring a winner.
- Compare conversion rate, revenue, and engagement metrics together.
- Record the final decision and apply the winning variant only after reviewing the full test period.
Start With a Clean Mida.so Experiment Setup
Real-time data is only useful when the experiment has a clear structure. Start in Mida.so by creating the test, naming both variants, and identifying the page or product area being tested.
Use a name that states the change and the target audience. “Checkout Button Color Test” is more useful than “Experiment 14.” Add the launch date and, if relevant, the traffic source or device group.
Choose a control and a variant. The control is the current experience. The variant contains one defined change. Keep the test focused. If you change the headline, pricing display, and checkout form at the same time, you won’t know which change affected the result.
Select one primary conversion goal. Examples include:
- Completed purchase
- Submitted lead form
- Started free trial
- Activated account
- Clicked a product demo request
Add secondary metrics for context. These can include average order value, revenue per visitor, form starts, session duration, or a product engagement event. Secondary metrics shouldn’t replace the primary goal when you decide which variant wins.
Check the audience definition before launch. Confirm that Mida.so is measuring eligible users rather than every visit. A returning customer, a logged-out visitor, and a paid campaign visitor may belong to different segments. Mixing them can hide a real performance difference.
Check the event setup as well. Trigger the primary conversion once per intended user action. A duplicate purchase event can inflate revenue and conversion counts. A page reload shouldn’t create another signup.
A clean experiment setup prevents most reporting problems before the first visitor enters the test.
Launch only after you test both experiences yourself. Open the page on desktop and mobile. Complete the conversion action. Then confirm that Mida.so records the exposure and the conversion under the correct variant.
Read the Mida.so Dashboard in the Right Order
The dashboard gives you a live view of what is happening inside the test. Don’t start with the largest percentage on the screen. Read the data in a fixed order.
First, check traffic allocation. If the test should split visitors evenly, confirm that the control and variant are receiving comparable traffic. A large imbalance can come from targeting rules, audience exclusions, technical errors, or a test that hasn’t collected enough visitors.
Next, check the number of exposed users. A conversion rate based on 20 visitors can move sharply after one conversion. The same rate based on thousands of visitors is more stable. Mida.so may update results quickly, but fast updates don’t automatically create reliable evidence.
Then review the primary conversion rate. Use the same denominator for both variants:
Conversion rate = conversions / eligible visitors x 100
For example, if the control receives 2,000 eligible visitors and generates 100 purchases, its conversion rate is 5%. If the variant receives 2,000 visitors and generates 120 purchases, its rate is 6%. The variant has a 20% relative lift, but you still need to review sample size and confidence before acting.
After conversion rate, inspect the revenue metrics. A variant can produce more orders while generating less money if it attracts lower-value purchases. Review total revenue, revenue per visitor, and average order value when those events are available in your Mida.so setup.
| Metric | Calculation | What it tells you |
|---|---|---|
| Conversion rate | Conversions / visitors | How often users complete the goal |
| Revenue per visitor | Revenue / visitors | Economic value created by each visitor |
| Average order value | Revenue / orders | Value of each completed purchase |
| Engagement rate | Engaged users / visitors | Whether users interact with the experience |
Finish with engagement metrics. Monitor clicks, form starts, scroll depth, feature use, or other events that match the page purpose. A new landing page may increase button clicks but reduce completed forms. That is not a winning result if the primary goal is lead submission.
Use filters carefully. Compare the same date range, audience, device type, and traffic source when investigating a change. Segment data is useful for diagnosis, but small segments can produce unstable results.
Use Live Results Without Stopping Too Early
A real-time dashboard is a monitoring tool. It isn’t a permission slip to stop every test as soon as one line moves above another.
Early results change because the sample is small. One purchase can push a new variant ahead. Several hours of paid traffic can make a result look stronger than it does across the full week. A weekend audience may also behave differently from a weekday audience.
Set the test duration before launch. The right period depends on traffic volume, conversion volume, buying cycles, and the audience you need to represent. A low-traffic B2B form test may need more time than a high-volume ecommerce checkout test.
Set a minimum sample size as well. Your threshold should cover enough users and conversions to make the comparison useful. If Mida.so shows an experiment confidence value, review it alongside the raw counts and lift. Don’t treat a high percentage lift as proof when both variants have limited exposure.
Statistical confidence measures how strongly the observed difference separates from random variation. Many teams use a 95% confidence threshold, but the threshold should match your testing policy and risk level. A small copy change may tolerate less risk than a pricing or checkout change.
Review these four conditions before you stop a test:
- Both variants have reached the planned audience and sample thresholds.
- The test has run through normal weekday and weekend behavior when relevant.
- The primary metric shows a stable difference across recent periods.
- The result reaches your chosen confidence standard.
Watch for novelty effects. Users may react to a new layout because it looks different, not because it works better. The effect can weaken after visitors return. A longer test helps expose that pattern.
Watch for external changes too. A promotion, product outage, tracking release, email campaign, or major traffic source shift can affect one period. Add an annotation to your experiment record when a known event changes the audience or user journey.
Don’t use real-time results to rewrite the test halfway through. Changing the audience, goal, traffic split, or variant during collection makes the final comparison harder to trust. If the setup is wrong, pause the test, document the issue, and create a corrected version.
The dashboard tells you what needs attention now. Test duration and statistical confidence help you decide what to do next.
Build a Repeatable Mida.so Review Workflow
A repeatable review process keeps the team from reacting to every dashboard update. Assign one person to check the experiment each day, or set a schedule that matches your traffic volume.
Start each review with data quality. Confirm that traffic is reaching both variants. Check whether exposure events and conversion events are still firing. Look for sudden drops in visitors, conversions, or revenue.
Review the primary metric next. Record the current conversion rate for each variant, the absolute difference, and the relative lift. Then review revenue and engagement metrics for conflicts.
For example, imagine a product page test produces these results:
- Control conversion rate: 4.8%
- Variant conversion rate: 5.3%
- Control revenue per visitor: $3.40
- Variant revenue per visitor: $3.05
- Variant product-detail clicks: 12% higher
The variant attracts more clicks and more conversions, but it creates less revenue per visitor. That result needs investigation. It may drive low-value orders, attract users who abandon later, or change the product mix. Declaring the variant a winner from conversion rate alone would be premature.
Record the review in the experiment notes. Include the date, traffic count, conversion count, current confidence, major segments, and any known traffic changes. Keep the note factual. A short history makes later analysis easier.
Use a simple decision status:
- Monitoring: The test is collecting data normally.
- Investigate: Tracking, allocation, or metric behavior needs review.
- Ready for decision: Sample, duration, and confidence thresholds are complete.
- Complete: The result is documented and the next implementation step is assigned.
When the test is complete, document the decision in Mida.so or your experiment log. State which variant won on the primary goal, what happened to revenue and engagement, and whether the result applies to all users or only a segment.
Fix Common Data Problems Before Acting
A sudden lift isn’t always a product improvement. It can come from bad event collection.
Check for duplicate conversions when the rate rises sharply. Check for missing events when both variants show an unexpected decline. Compare Mida.so data with your payment processor, CRM, or analytics platform when revenue or lead counts don’t match.
Review attribution rules too. A user may see one variant and convert after returning through another channel. Your reporting system needs a consistent rule for assigning that conversion to the experiment.
Separate bot traffic and internal testing traffic where possible. Employees, automated scanners, and repeated test sessions can distort engagement and conversion metrics.
Don’t remove outliers without a documented reason. If you exclude a device group, campaign, or date range, record the rule before comparing variants. Otherwise, the final result becomes difficult to reproduce.
Conclusion
Mida.so makes it easier to watch A/B test performance while users move through your site or product. Use that visibility to catch tracking problems, traffic imbalances, and unusual metric changes early.
The final decision needs more than a live percentage. Review the primary conversion goal, revenue per visitor, engagement behavior, sample size, test duration, and statistical confidence together. Real-time data helps you monitor faster, but disciplined test analysis tells you when the result is ready to use.
