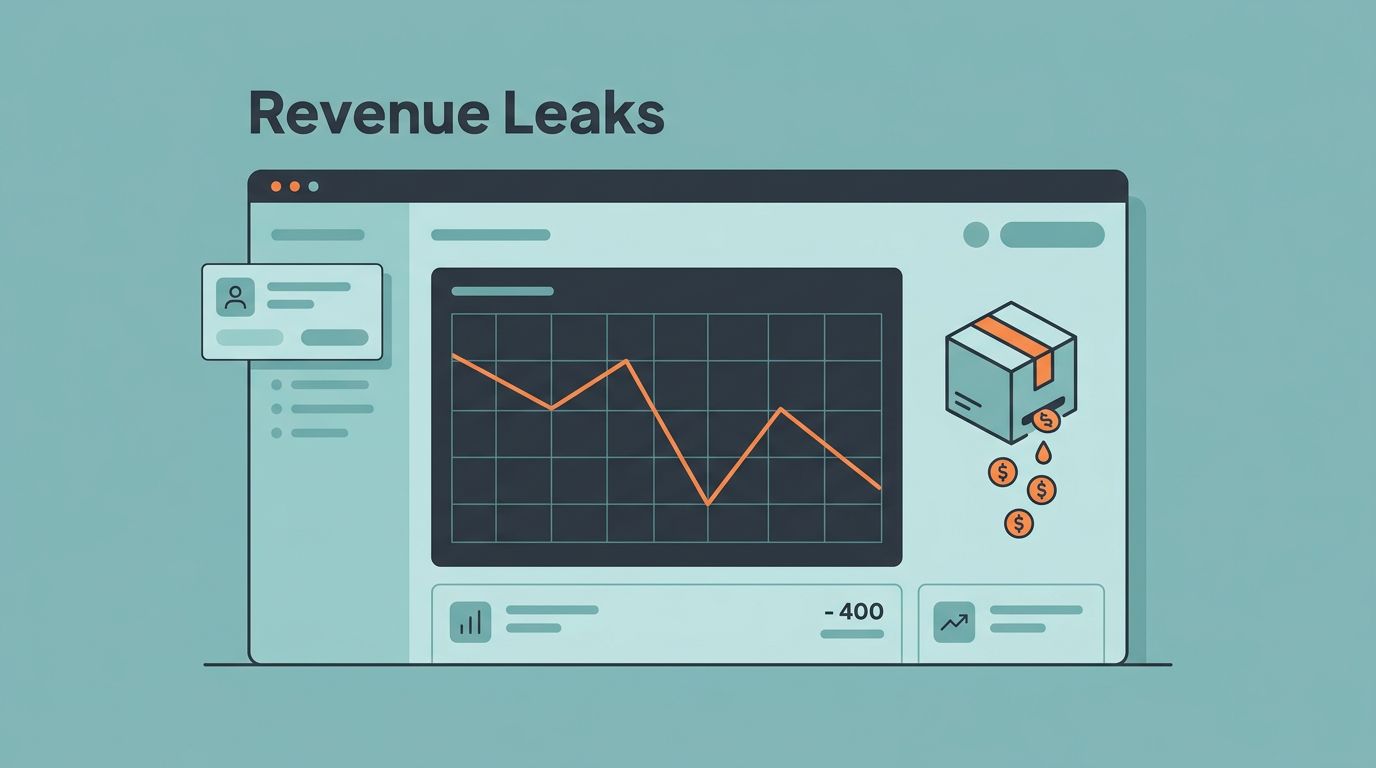
I run a subscription app for marketing teams. One month, my MRR dropped 8%. I blamed the market. Then I dug into the data. Failed cards and quiet cancellations ate 12% of my expected revenue. Those SaaS revenue leaks hid in plain sight.
You face the same issue. Billing glitches turn paying customers into ghosts. Churn creeps up from payment fails, not product flaws. Tools like Baremetrics spot these holes fast. They pull data from Stripe or Braintree and show the real picture.
I’ll share how I fixed my leaks. First, I learned what causes them.
What Counts as a SaaS Revenue Leak
Revenue leaks drain MRR without fanfare. They happen when subscriptions lapse due to billing errors. A customer loves your tool but their card expires. No retry, no notice. Poof, gone.
In my case, leaks split into two buckets. Involuntary churn from failed payments hit 25% of my total losses. The rest came from missed expansions or refunds I mishandled. Overall B2B SaaS sees 20-40% of churn from payments alone, per recent benchmarks.
Why do they persist? Billing systems log fails but don’t act. Stripe retries once or twice. Then silence. Customers forget. You lose 5-15% of MRR monthly without smart recovery.
I ignored this at first. Spreadsheets hid the scale. Each leak seemed small. Added up, they starved growth. Baremetrics changed that. It flags issues in real time.
Spotting Hidden SaaS Revenue Leaks
Leaks mimic normal churn. You see MRR dip and assume users bail. Reality differs. Failed payments create invisible churn. Paused subs linger as active. Refunds distort forecasts.
Benchmarks confirm the pain. SMB SaaS loses 3-7% monthly to churn. Half ties to billing fails. Enterprise does better at 0.5-2%, but leaks still bite. Recovery rates hover at 50-80% with automation.

I connected Baremetrics to my Stripe account. It broke down MRR into new, expansion, contraction, and churned slices. One view showed 4% of my base at risk from expired cards. Another highlighted retention drops by cohort.
For deeper stats on failed payment recovery, Baremetrics own guides match my findings. They note 30-70% salvage possible. I recovered $2K in week one.
Spot patterns early. Segment by plan tier. Watch ARPU shifts. Leaks cluster in high-value accounts. Fix them before they spread.
Why Failed Payments Cause the Worst Leaks
Failed payments top the list. Cards expire. Funds dip low. Fraud flags trigger. Result? Involuntary churn at 20-48% of total.
I lost a 10-user agency client this way. Their controller updated the card late. One fail, cancel. No dunning email meant no second chance. Industry data shows monthly fails exceed 1.2% in weak setups.
Other culprits pile on. Chargebacks from disputes eat 1-2%. Forgotten pauses overstate MRR. Downgrades slip past without alerts.
In my workflow, these stacked. MRR looked flat. Cash flow shrank. Baremetrics separated card issues from true product churn. That clarity let me act.
You need visibility first. Track recovery rates. Aim above 50%. Below that, leaks grow.
Recover Failed Payments Fast
Automation turns fails into wins. Baremetrics Recover handles retries, emails, and card updates. No manual hunts.
Here’s the flow I follow. First, connect your processor. Baremetrics pulls events live. Set retry rules: day 1, 3, 7, with escalating notes.

Next, customize dunning. Soft nudge first: “Card issue? Update here.” Then firm: “Last chance before pause.” I see 60% recovery this way.
Test sequences. A/B emails by segment. Track open rates. My best lifted salvage by 15 points.
For more on understanding failed payments, check Baremetrics resources. They integrate with Recurly too.
Result? My involuntary churn fell to 0.8%. MRR stabilized. Scale this across teams.
Baremetrics Dashboard in Action
The dashboard pulls it together. Clean graphs track MRR trends. Churn splits by customer and revenue. LTV and NRR sit front and center.

I segment cohorts. New users churn higher from onboarding fails. Veterans leak via expansions I miss. Alerts ping Slack on spikes.
Key metrics I watch:
| Metric | My Target | Why Track It |
|---|---|---|
| MRR Churn | Under 2% | Flags dollar losses fast |
| Customer Churn | Under 3% | Spots account risks |
| Recovery Rate | Over 60% | Measures dunning wins |
| NRR | Above 105% | Shows growth from upsells |
This setup caught a refund wave early. I adjusted policies before impact.
I use Baremetrics dashboard for MRR and churn daily. It ties to keeping SaaS MRR accurate. For metrics that catch churn, those posts detail more.
Retention Issues and Missed Insights
Leaks extend to retention. Users pause, not cancel. Billing logs them active. MRR inflates.
Baremetrics flags pauses separate from churn. I reactivate 30% with winback flows. Missed insights hurt too. No expansion tracking means silent growth.
I set goals: NRR over 100%. Track ARPU by tier. Alerts on drops prompt checks.
On failed payment recovery with Baremetrics, I cover dunning loops. Pair with revenue recognition via Baremetrics workflows.
Quick Checklist to Plug Leaks
Use this to audit your setup:
- Connect analytics to billing data.
- Review failed payment rates weekly.
- Test dunning sequences quarterly.
- Segment MRR by cohort and plan.
- Set alerts for churn over 2%.
- Validate Baremetrics fits your stack, like Stripe.
Run it monthly. I gained 5% MRR in three months.
For churn fixes, see proven ways to reduce SaaS churn. On revenue leakage causes, they note smart retries recover 27% more.
Conclusion
SaaS revenue leaks cost real cash. I plugged mine with Baremetrics visibility and Recover automation. Churn dropped. MRR grew steady.
Pick tools that match your billing flow. Test small. Scale wins. Your numbers will thank you.