You’ve watched your MRR climb, only to see it stall. New customers bring fresh revenue, but what about the ones already paying? That’s where SaaS upgrade revenue steps in. It fills gaps left by churn and powers steady growth.
I run a SaaS business, and Baremetrics has become my go-to tool for spotting those upgrades. Customers bump up plans or add seats, and that expansion revenue keeps the lights on without constant acquisition spend. In 2026, with usage-based billing on the rise, tracking this matters more than ever.
Let me show you how I do it. We start with the core metrics.
Why SaaS Upgrade Revenue Drives Real Growth
Upgrade revenue isn’t just extra cash. It signals happy customers who see value in your product. When a user switches from basic to pro, they commit deeper. That boosts lifetime value and offsets downgrades.
Think of your revenue stream as a river. New MRR flows in from one side. Churn pulls from the other. Upgrades widen the channel, letting more water through. Without them, even strong acquisition feels fragile.
I check this weekly because small shifts add up. Last quarter, upgrades made up 25% of my MRR growth. Ignore it, and you miss chances to nurture power users.
Baremetrics pulls data straight from Stripe or your processor. No spreadsheets needed. It breaks revenue into clear buckets: new, expansion, contraction, and churned MRR. Expansion covers upgrades, seat adds, and overages.
Teams often overlook contraction MRR. Downgrades eat gains quietly. I compare the two side by side. If expansion lags, I dig into customer feedback or pricing.
For deeper math on expansion MRR, Baremetrics’ metrics page lists all 28+ tracked items, including upgrades.
This focus keeps my reports honest for founders and finance leads.
Key Metrics to Track in Baremetrics
Baremetrics shines here. I start with the MRR breakdown. It shows expansion revenue as a distinct line, separate from new sales.
Key ones I watch:
Expansion MRR: Dollars from upgrades and upsells. I aim for it to exceed contraction by 2x.
Net Revenue Retention (NRR): Above 100% means existing customers grow revenue. Below signals trouble.
Average Revenue Per User (ARPU): Track by plan. Rising ARPU often ties to upgrades.
Customer Lifetime Value (LTV): Upgrades extend this, justifying acquisition costs.
Here’s a quick view of what I monitor:
| Metric | What It Shows | My Target |
|---|---|---|
| Expansion MRR | Upgrade gains | >20% of total MRR |
| Contraction MRR | Downgrade losses | <10% of total MRR |
| NRR | Net growth from customers | 110%+ |
| ARPU by Plan | Upgrade impact | Pro plan 1.5x basic |
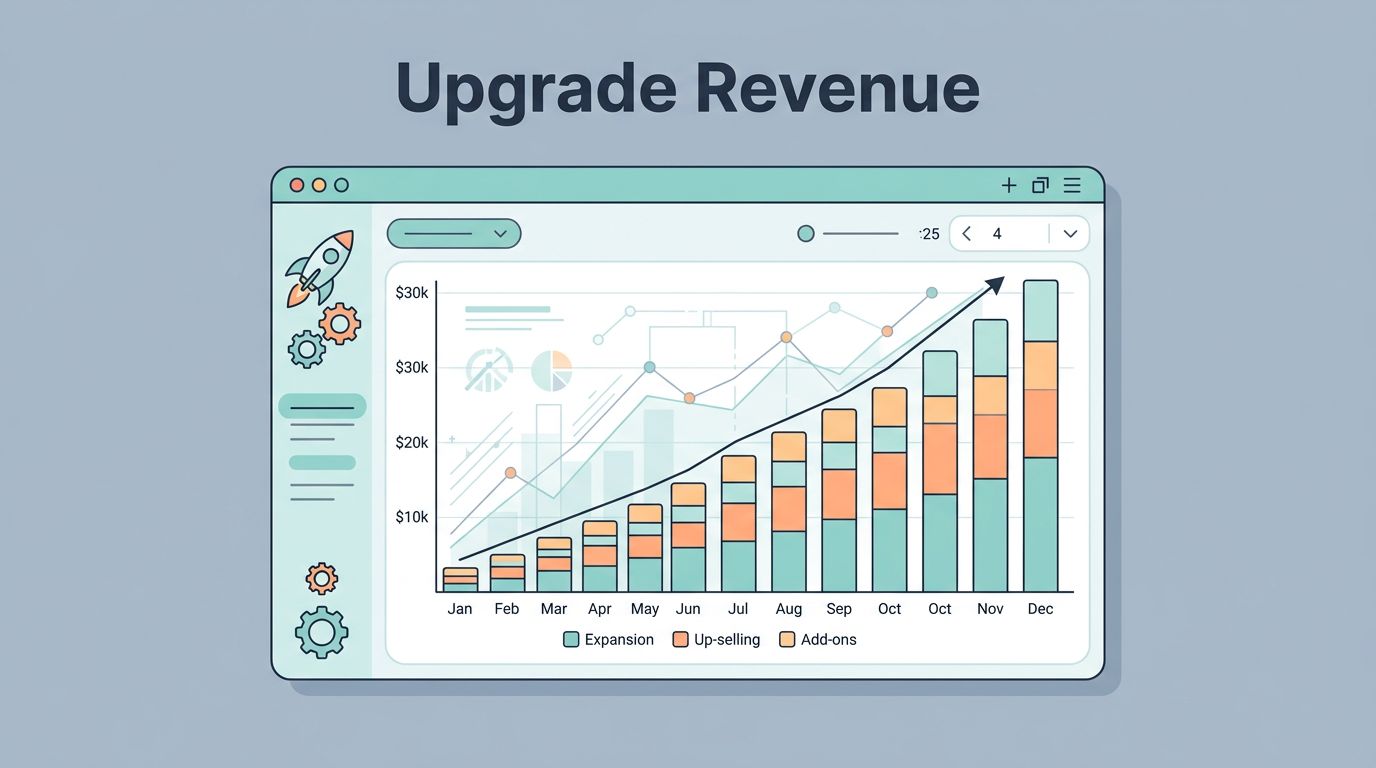
These numbers update live. After the table, I scan trends. A spike in expansion? Time to replicate what worked.


That dashboard view above captures it. Clean charts highlight where upgrades push the needle.
I also segment by cohort. Older groups upgrade less, so I target them with feature nudges. New 2026 tools like usage revenue tracking help here, blending fixed and variable income.
For MRR components like expansion and churn, check my Baremetrics MRR accuracy guide.
Setting Up Your Baremetrics Dashboard
First, connect your processor. Baremetrics syncs Stripe data in minutes. I use the Growth plan at $255/month for custom dashboards and benchmarks.
Go to Dashboards. Drag MRR cards to the top. Pin expansion revenue next to churn. Add ARPU trends below.
Next, enable segments. Filter by plan or sign-up month. This reveals upgrade patterns fast.
Set alerts. If expansion drops below $2K weekly, Slack pings me. No more manual checks.
I add notes to charts. Link a big upgrade to our latest feature launch. Context beats raw numbers.
Smart Dashboards refresh as bills process. Compare to benchmarks from similar SaaS firms. If your expansion lags peers, pricing or onboarding needs work.
For custom setups tracking MRR and churn, see Baremetrics dashboard for MRR and churn.
Test it end-to-end. Pull a report. Share via email. Finance loves the clarity.
This setup takes 30 minutes. Then it runs itself.
Analyzing Cohorts and Segmentation
Cohorts group customers by start date. I track how Q1 2026 sign-ups upgrade versus Q4 2025.
In Baremetrics, hit Cohorts. Select expansion revenue. Lines show upgrade paths over months.
Segmentation adds power. Slice by industry or plan. Tech firms upgrade 30% faster than retail in my data.
Why bother? One cohort might hoard low plans. Nudge them with trials of pro features.
2026 updates let me build custom segments. Tag high-usage users. Watch their expansion soar.
Steps I follow:
- Load cohort view.
- Filter expansion MRR.
- Spot flat lines. Cross-check logins or support tickets.
- Segment risers. Replicate onboarding.
- Forecast impact with Forecast+ tool.
This uncovers hidden opportunities. A flat cohort? Run a win-back campaign.

Graphs like that one make patterns pop.
For pricing churn and expansion metrics, my Baremetrics pricing metrics analysis breaks it down further.
Weekly Monitoring Routine
Mondays, I spend 15 minutes on Baremetrics. Check expansion versus contraction. Green if expansion leads.
Note changes. $1.5K upgrade spike? Tie it to Friday’s email blast.
Weekly targets: Expansion >15% of MRR growth. ARPU up 2%. Alerts flag misses.
Monthly, dive deeper. Run cohort reports. Compare NRR to last period. Share with team via automated email.
People Insights pulls customer stories. High LTV user stagnating? Personal outreach.
I set three Forecast+ scenarios. Base assumes steady upgrades. Worst cuts them 20%.

Routine reviews like this keep me ahead.
Baremetrics Academy on SaaS metrics offers more on expansion tactics.
Use Cases That Pay Off
Power user upgrades: Segment top 10% ARPU. Offer enterprise trials. Last month, three converted.
Churn offset: Pair expansion with low churn cohorts. Study what sticks.
Pricing tests: Track upgrades pre- and post-change. ARPU jumps validate hikes.
Board reports: One chart shows net MRR with expansion highlighted. Clear wins.
For Baremetrics expansion revenue tracking, read how to monitor expansion MRR in Baremetrics.
These keep growth real.
Conclusion
SaaS upgrade revenue turns steady payers into growth engines. Baremetrics makes tracking simple, from dashboards to cohorts.
I rely on it for honest MRR views and quick wins. Expansion now drives 30% of my gains.
Start with your dashboard today. Watch the numbers shift. Your bottom line will thank you.