Scrape Technical Indicators Live With Twin.so
Live market data is only useful when you can explain where every number came from. If you want to scrape technical indicators, Twin.so can remove repetitive browser work, but it can’t repair a weak source definition or an unstable cal...
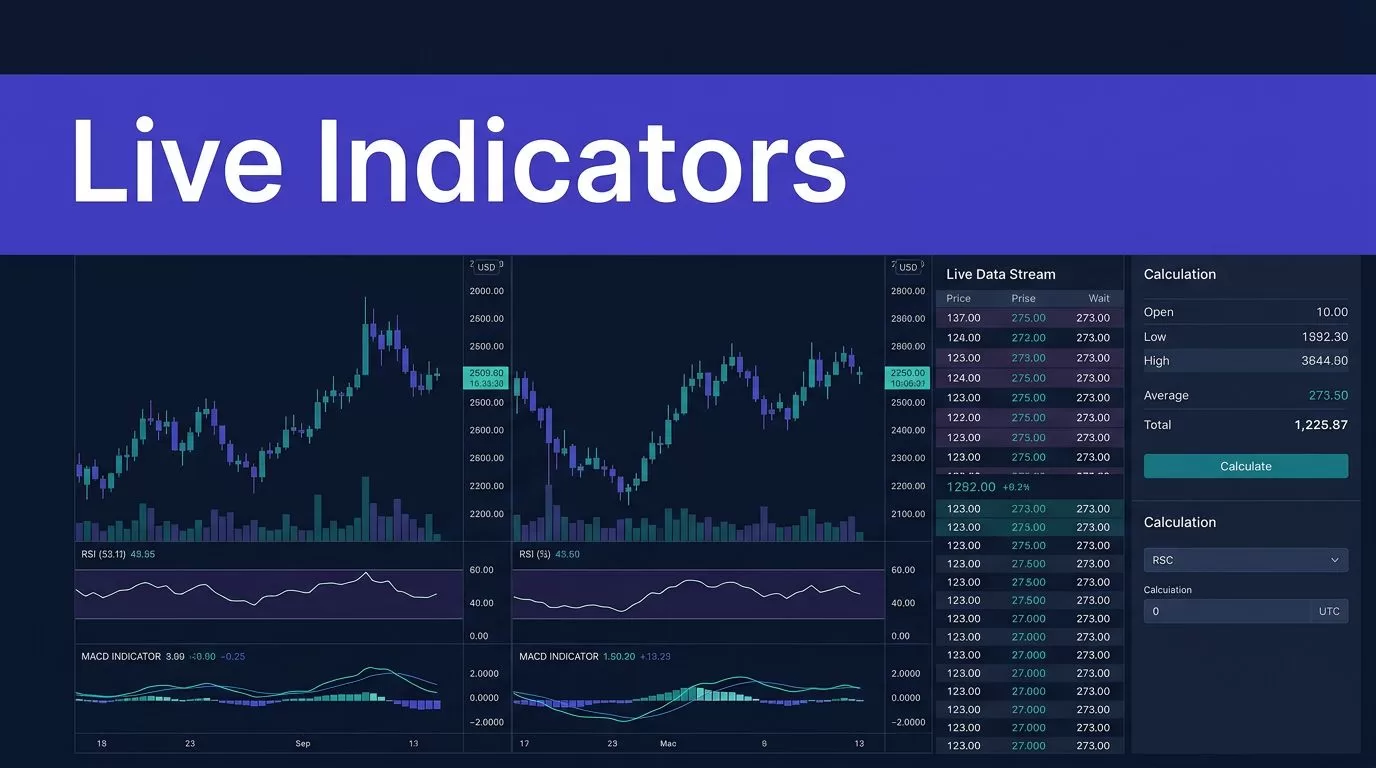
Live market data is only useful when you can explain where every number came from. If you want to scrape technical indicators, Twin.so can remove repetitive browser work, but it can’t repair a weak source definition or an unstable calculation.
Use Twin.so to collect approved market data, then calculate or extract indicators under fixed rules. Record the source, symbol, interval, parameters, timestamp, and validation status with every result. Start by defining what “live” means for your system.
DEFINE WHAT “LIVE” MEANS
A technical indicator is a calculation based on price, volume, or open interest. Moving averages, RSI, MACD, ATR, and volume-based indicators all depend on clean inputs and consistent settings.
Use APIs for the feed
Use an exchange, broker, or licensed market-data API when one is available. APIs usually provide clearer schemas, stronger timestamp control, lower latency, and more predictable rate limits than browser extraction.
Twin’s documentation recommends using APIs and built-in tools before forcing browser automation. Browser work costs more and can fail when a page layout changes. It also isn’t suitable for high-frequency trading or tick-level execution.
Use Twin.so to trigger the API request, filter the response, calculate indicators, and send approved output to your database or alerting system.
Use Web Agent for UI-only data
Twin’s Web Agent documentation covers browser tasks involving dynamic pages, multi-step navigation, and login-protected websites. This is useful when a portal shows data in a table or chart but offers no usable API.
Set up approved authentication through the configured Twin environment. Don’t place passwords, session cookies, or private tokens inside plain-language instructions. Confirm that automated access is permitted before collecting anything.
A chart is not automatically a data feed. If the source exposes only visual chart values, look for an underlying table, download option, or official API first. Extracting pixels should be the last option.
SET THE DATA CONTRACT BEFORE BUILDING
Your workflow needs a fixed contract before it opens a browser. Without one, the same symbol can return different results depending on the page, timezone, interval, or indicator settings.
Fix the source assumptions
Define the following fields before creating the Twin agent:
| Field | Example | Why it matters |
|---|---|---|
| Instrument | AAPL, NASDAQ | Prevents symbol ambiguity |
| Interval | 5-minute candles | Controls every calculation |
| Timestamp | UTC candle close | Makes freshness measurable |
| Price basis | Adjusted or unadjusted OHLC | Affects historical values |
| Lookback | 200 candles | Provides enough calculation history |
| Indicators | SMA 20, RSI 14 | Makes parameters reproducible |
| Source | Provider name and URL | Creates an audit trail |
State whether you need stocks, forex, crypto, futures, or another asset type. Symbols and trading hours differ across venues. Also define whether volume means reported exchange volume, tick volume, or another provider-specific field.
Set a bar-close rule
A live indicator based on an open candle can change every time the price moves. Decide whether your system accepts provisional values or waits for a closed candle.
For most monitoring workflows, use the latest completed bar. A five-minute strategy might run shortly after each five-minute close. A one-hour strategy might run once per hour after the provider publishes the completed candle.
Store both bar_close_time and collected_at. The first describes the market record. The second describes when Twin.so obtained it.
HOW TO SCRAPE TECHNICAL INDICATORS WITH TWIN.SO
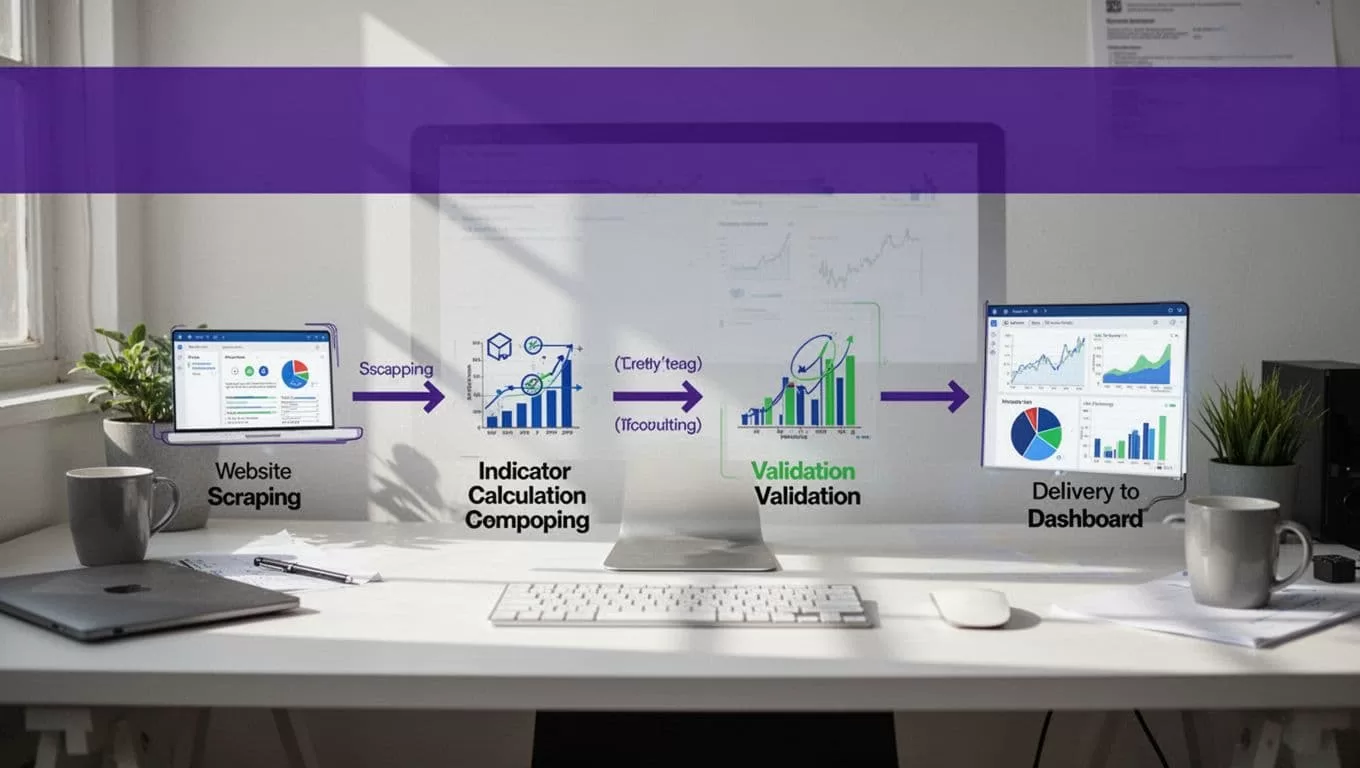
Build the workflow around structured output, not browser activity. Twin.so should collect the required values, return a predictable record, and stop when the source or schema fails.
Write extraction instructions that remove ambiguity
Your Twin instruction should name the approved source, instrument, interval, fields, and output format. Include the timezone and bar-close rule.
A practical sequence is:
- Open the approved market-data page or connected endpoint.
- Select the exact instrument and requested interval.
- Extract timestamp, open, high, low, close, volume, and displayed indicator values.
- Return one structured record per completed candle.
- Stop and return an exception when fields are missing, authentication fails, or the page structure changes.
Include the source URL and collection timestamp in every result. If you scrape an indicator already displayed by the site, also capture its visible parameters when available.
Separate collection from delivery
Don’t let the browser workflow write directly into a live trading system on its first run. Send results to a staging table, queue, spreadsheet, or review endpoint.
The downstream job can then validate the schema, calculate indicators, compare expected row counts, and publish accepted records. Keep the raw response separate from the derived values. This makes corrections possible when a provider changes its calculation method.
Twin supports workflows triggered by schedules, webhooks, or API requests. Build the agent once, then use repeat runs for production collection. Avoid rebuilding the workflow for every symbol or interval.
CALCULATE INDICATORS IN A CONTROLLED STEP
If you scrape technical indicators from a page, you may be collecting someone else’s calculation settings. A displayed RSI can use a different period, smoothing method, price basis, or candle history than your system.
Fix parameters and formulas
Keep indicator settings in configuration rather than inside changing browser instructions. A small test configuration could include:
- SMA with a 20-period window.
- EMA with a 50-period window.
- RSI with a 14-period period.
- MACD with 12, 26, and 9 periods.
- ATR with a 14-period window.
Use one calculation library and version it with your application. Seed values and smoothing rules can change results, especially for RSI, EMA, MACD, and ATR. Investopedia’s technical indicators overview provides useful background on common indicator categories and inputs.
For repeatable research, calculate indicators from raw OHLCV data in Python, SQL, or your existing quantitative pipeline. Use Twin.so for collection and orchestration unless the source’s displayed value is the exact value you need.
Preserve raw and derived values
Store the raw candle before writing the indicator result. A useful record includes symbol, venue, interval, bar_close_time, open, high, low, close, volume, indicator_name, indicator_parameters, indicator_value, source_url, and collected_at.
This structure lets you recalculate a value without scraping the source again. It also helps you explain why two systems disagree.
Do not overwrite a previously accepted record when a later run produces a different value. Store a new version or route the conflict for review.
VALIDATE BEFORE WRITING RESULTS
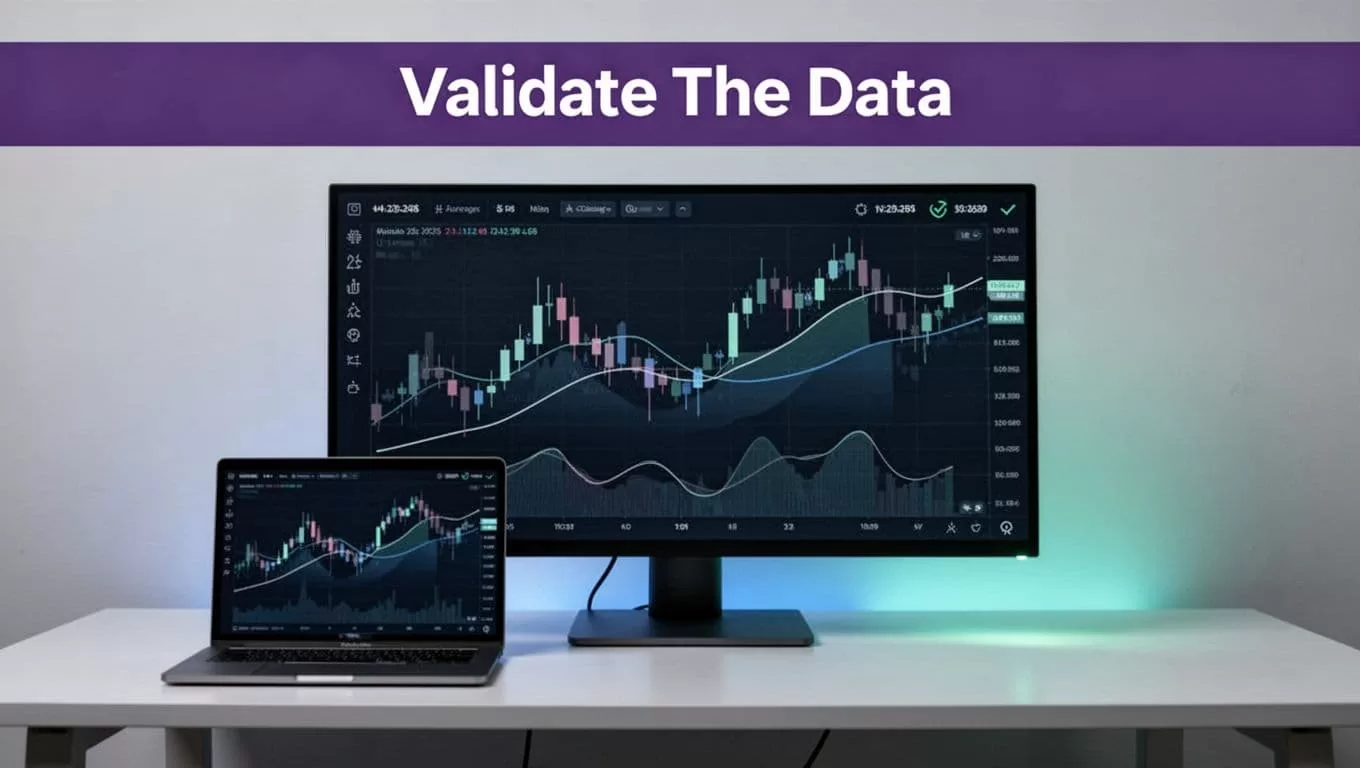
A browser task can finish without an error and still skip rows, read stale content, or capture the wrong instrument. Validation belongs between extraction and delivery.
Check each batch
Reject or hold a batch when:
- Required fields are missing or contain non-numeric values.
- The timestamp is older than the allowed freshness window.
- High is below low, or close falls outside the high-low range.
- The same symbol, interval, and candle timestamp appears twice.
- The row count differs sharply from the expected result.
- The source returns a login page, error page, or incomplete chart.
- The indicator value falls outside an accepted range, such as RSI below 0 or above 100.
Use stable keys such as symbol + interval + bar_close_time. Save progress by symbol, page, cursor, or candle timestamp when the source supports it.
Compare known outputs
Test the workflow against a small set of values from the source and an independent calculation. Compare the raw candle, timestamp, timezone, parameters, and final value. Volume deserves separate attention because providers may report it differently. Charles Schwab’s guide on trading volume as a market indicator explains why volume data needs context rather than blind aggregation.
A completed run proves that Twin.so finished the task. It doesn’t prove that the result is complete, current, or correct.
Use report-only mode during the pilot. Enable database writes or alerts after the output passes field-level checks.
SET CADENCE, COST, AND RECOVERY
Live collection is a scheduling problem as much as a scraping problem. Match the run frequency to the source’s update cycle and your actual decision window.
Match polling to the bar
Don’t poll every second for a five-minute indicator. That creates duplicate work, increases credit usage, and may trigger source restrictions.
Run after the expected candle close with a short delay for provider publication. Use a longer interval when the source updates slowly. If you need tick-level or execution-grade data, use a dedicated market-data feed instead of browser automation.
Budget accepted records
Twin’s pricing documentation gives planning examples, not fixed quotes. A simple API, filter, and notification workflow may use about 15 to 30 credits. A scrape covering roughly 100 items may use about 20 to 70 credits. A browser session with around 20 steps may use about 100 to 200 credits. Review the current Twin pricing documentation before budgeting.
Benchmark a small approved batch before scaling. Track credits per run, accepted records, missing and duplicate records, failed runs, retry counts, human review minutes, correction time, and cost per accepted record.
A workflow that saves ten minutes but creates thirty minutes of correction work has failed. Define a manual fallback and identify the last trusted result before production. If the project spans several providers, symbols, or review queues, Book A Call to map the data contract and exception process.
TROUBLESHOOTING A LIVE SCRAPER
Empty or stale results
A blank value often means the page loaded a chart after the initial request. Add a wait for the required table or page state. Confirm that Twin selected the intended symbol and interval. If the page still exposes no stable values, switch to an API or downloadable file.
Stale results usually come from cached pages, expired sessions, or a source that updates after the expected time. Compare bar_close_time with collected_at and hold records outside the freshness window.
Duplicates, timeouts, and layout changes
Use bounded retries with backoff for temporary network failures. Don’t retry permission errors, failed authentication, or changed schemas indefinitely.
When pagination or page structure changes, stop the write step and route the batch to review. Compare the latest output with a known sample. Record the last successful symbol or timestamp so recovery doesn’t restart the entire collection job.
RESPECT SOURCE RULES AND TRADING LIMITS
A publicly visible page isn’t automatically approved for automated extraction. Review the website’s terms, market-data license, storage limits, redistribution rules, and attribution requirements. Don’t bypass access controls or collect data outside the permitted account or use case.
Twin’s public materials don’t establish one universal requests-per-minute limit for every source. Set your own pacing, concurrency, timeout, and retry controls. Keep credentials in approved secrets storage.
Scraped indicators are calculations, not financial advice. Validate the data before using it in research, alerts, or trading software. Require human approval for decisions that could place orders or create financial exposure.
CONCLUSION
Twin.so works best as the collection and workflow layer around a controlled market-data pipeline. Use an API when one exists, use the Web Agent for approved UI-only sources, and keep raw candles separate from derived indicators.
Define the instrument, interval, timezone, parameters, freshness rule, and failure behavior before the first run. Measure accepted records and correction time, not browser activity. Reliable live indicators come from disciplined data handling, not from scraping faster.
