I remember staring at my Stripe dashboard last year. Payments flowed in fine. But when a key customer churned, I had no quick way to spot why or predict the hit to my MRR. Founders like me need more than transaction lists. You run a SaaS business. Stripe handles billing well. Yet it leaves gaps in subscription analytics. That’s why I moved to Baremetrics as my Stripe dashboard alternative. It pulls Stripe data and turns it into actionable views on churn, LTV, and forecasts. In this post, I share how that switch sharpened my decisions.
Why the Stripe Dashboard Isn’t Enough
Stripe shines for payments. It processes charges, manages refunds, and shows basic revenue trends. I rely on it daily for those ops. But as my SaaS grew past $10K MRR, cracks appeared.
Basic charts cover payouts and active subs. They miss subscription health. No breakdowns by cohort or customer type. Churn hides in aggregates. You see total revenue drop. But why? Stripe does not segment by plan or region. Dunning stays basic too. Failed payments retry on autopilot. You cannot tweak emails or track recovery rates.
In 2026, with volatile markets, that’s risky. Investors want LTV and net retention. Finance teams need forecasts beyond simple projections. Stripe gives snapshots. Baremetrics-style tools build full pictures.

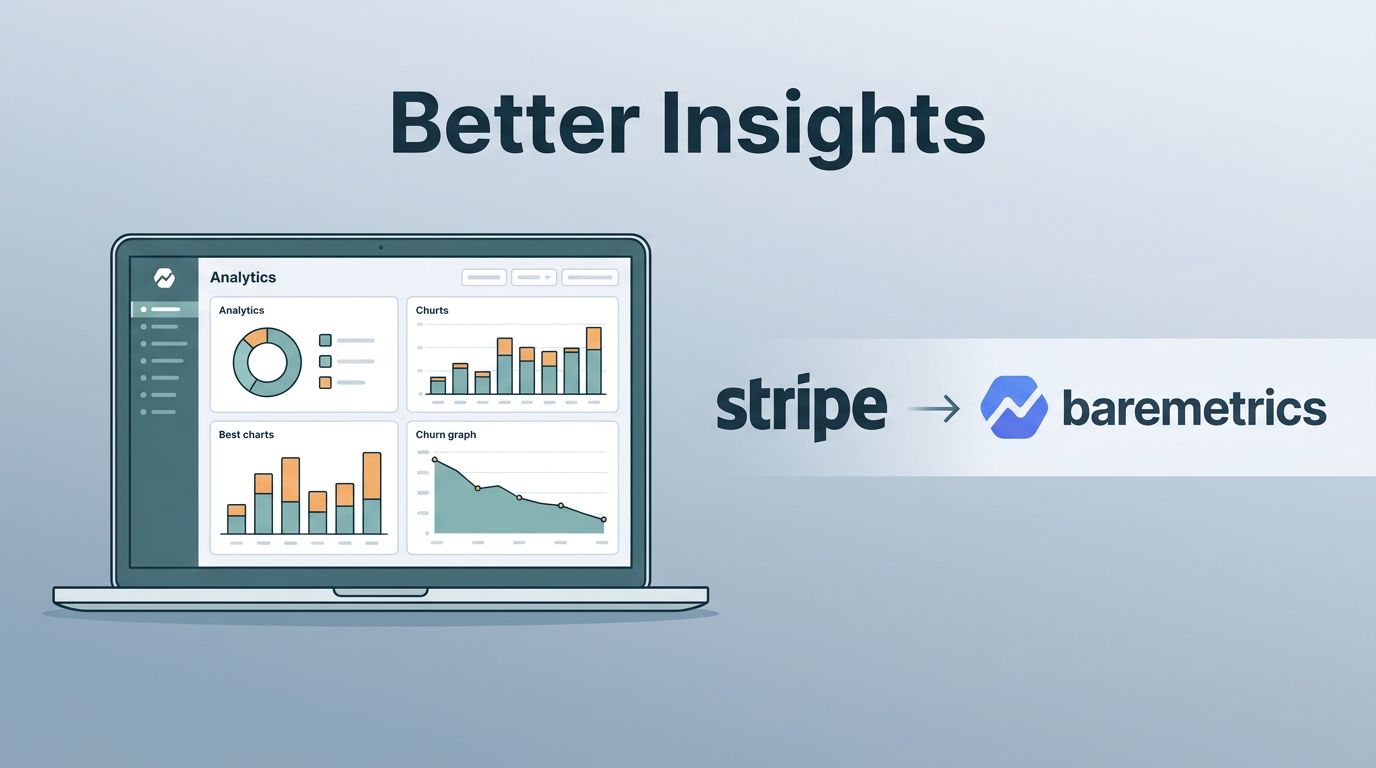
This side-by-side view matches what I saw. Left is Stripe: clean but shallow. Right mimics Baremetrics: layered metrics at a glance. I wasted hours exporting CSVs for Excel cohorts. Now, one dashboard suffices.
Baremetrics Delivers Deeper Subscription Analytics
I connected Baremetrics to Stripe in minutes. It syncs live data. No more manual pulls. This Stripe dashboard alternative focuses on SaaS needs. It calculates 26 metrics out of the box.
Think MRR breakdowns. Stripe shows gross revenue. Baremetrics nets out churn, expansions, and proration. You get true recurring value. Churn splits into customer and revenue types. One big logo loss does not mask rising small-account cancels.
For my team, custom segments matter. Filter by signup month, country, or plan. Spot patterns fast. Dunning emails match our brand. Recovery rates climbed 15% for me. Forecasting uses history plus goals. Run scenarios: what if churn halves?
Costs scale with MRR. Starts around $108 monthly. Worth it over spreadsheets. Stripe stays free for ops. Baremetrics layers insights on top.
Key Metrics: MRR, Churn, and LTV
MRR drives my focus. Stripe lists it basically. Baremetrics graphs trends with net new, expansion, and contraction lines. I see why revenue stalls.
Churn tells the real story. Customer churn counts lost accounts. Revenue churn measures MRR gone. Stripe lumps them. Baremetrics separates both. Plus, it flags reactivation. Last quarter, I recovered 8% of churn via alerts.
LTV ties it together. Multiply ARPU by retention. Baremetrics computes it automatically. Compare against CAC from ads. If LTV dips below 3x CAC, pause spend.

These visuals capture my daily view. Rising MRR greenlit hires. Churn pie showed monthly plans leaking. LTV bars guided pricing tweaks.
I track these in my Baremetrics dashboard for MRR tracking. For deeper dives on protecting MRR, check my post on Baremetrics metrics to catch churn.
| Metric | Stripe View | Baremetrics Edge |
|---|---|---|
| MRR | Gross totals | Net with breakdowns |
| Churn | Basic rates | Customer vs revenue, reactivations |
| LTV | Not calculated | Auto from ARPU and retention |
This table sums my switch. Baremetrics wins on depth. Others like illumi’s Stripe analytics offer similar at lower entry prices.
Cohort Analysis Reveals Retention Patterns
Cohorts group users by signup month. Track how they retain. Stripe skips this. Baremetrics plots curves. January cohort at 85% month one, 60% month six? Fix onboarding.
I segment further: by channel or device. Paid users retain better than organic. Adjust budgets accordingly. No exports needed. Curves update live.
This spots silent killers. A weak cohort drags LTV. Early fixes save MRR.
Dunning Keeps Revenue from Slipping Away
Failed payments kill 5-10% MRR yearly. Stripe retries generically. Baremetrics Recover customizes. I add our logo, tweak copy. Sequences: day 1 SMS, day 3 email.
Recovery dashboard shows rates. Mine hit 22%. That’s $2K saved monthly. Integrates Slack alerts for spikes.
Teams ignore dunning at peril. Baremetrics makes it hands-off yet tunable.
Forecasting Your SaaS Revenue
Projections beat gut feels. Stripe extrapolates renewals. Baremetrics Forecast+ blends trends, churn, and expansions. Set goals. See gaps.
I model: 10% churn cut adds $50K ARR. Peer benchmarks compare you to similar SaaS. In 2026 slowdowns, this guides burn rates.

Forecast graphs like this fueled my board decks. Upward arrows built confidence. Check my Baremetrics financial forecasting guide for setup steps.
Tools like Abner’s SaaS metrics dashboard add web analytics too.
Executive Reporting Without the Hassle
Execs want one page. MRR trend, churn rate, LTV/CAC, top risks. Stripe charts look good. But no drag-drop builds.
Baremetrics lets me pin metrics. Segment by VIP customers. Add notes: “Churn from pricing test.” Share links or PDFs. Slack pings on drops.
Finance pulls cleaner reports. No questions on calcs. I export less. Focus more.
Conclusion
Stripe handles payments. But for SaaS growth, a Stripe dashboard alternative like Baremetrics unlocks MRR truths, churn fixes, and revenue paths. I switched because basic views hid problems. Now, cohorts guide retention. Forecasts shape plans. Recovery saves cash.
Your setup might differ. Test Baremetrics free. Pull your Stripe data. See the difference yourself. In May 2026, clear metrics win markets.