How many times can a team download the same CSV before the process starts stealing attention? When I work with subscription data, the hard part is rarely Stripe itself. The real drag comes from the repeat work around it, the exports, the cleanups, and the small errors that creep in before a board meeting or month-end close.
I want revenue numbers I can trust without chasing a fresh file every Monday. That is where Stripe data exports stop being a manual chore and start becoming part of a reporting system.
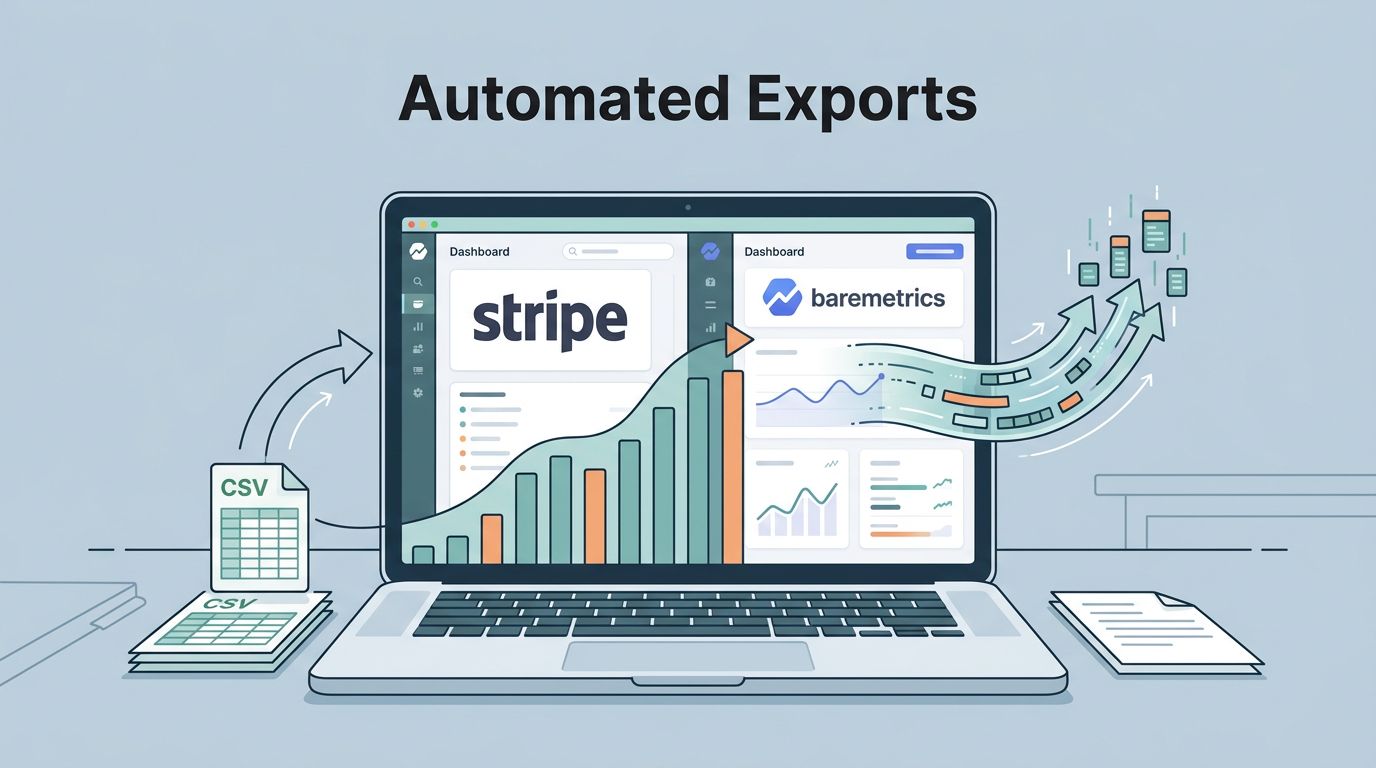
In this article, I look at how Baremetrics helps me turn Stripe data into recurring, usable reporting without living in spreadsheets. I also show where that saves time for founders, finance teams, and rev ops.
Why manual Stripe exports slow teams down
Stripe makes it easy to pull data, but easy does not mean effortless. The first export is simple. The fifth one, especially when it lands in a shared folder with a new file name, is where the trouble starts.
I see the same pattern often. Someone exports a customer list, another person exports payments, and a third person rebuilds a chart in Excel. By the time everyone compares numbers, the versions no longer match.

The real cost is not the download. It is the time spent checking whether the latest file is also the right file.
Manual exports also make recurring reporting fragile. If one analyst is out, the process slows down. If a field changes, the spreadsheet breaks. If a board deck needs the same chart every month, someone has to rebuild it again.
That is why I treat exports as part of infrastructure, not a one-off task. Raw files are useful for audits and spot checks. They are poor as a weekly habit.
What I want from recurring Stripe data exports
When I think about automated exports, I am not looking for more files. I want dependable access to the same numbers in the same place.
Stripe already offers useful paths for teams that need raw data. Its Data Pipeline can send data to a warehouse on a cadence, which is helpful when I want SQL access or a BI layer. Stripe also documents export customization options for delivery timing and report exports.
That matters because different teams need different levels of detail. Finance may need clean monthly revenue views. Rev ops may need cohorts and cancellation reasons. Founders may need one screen that shows the shape of the business in plain language.
Here is the shift I want.
| Need | Manual Stripe export | Baremetrics-style workflow |
|---|---|---|
| Monthly revenue review | Download CSVs and clean them first | Open a live dashboard with current metrics |
| Churn analysis | Merge customer and cancellation files by hand | Review churn, retention, and cancellation data in one place |
| Board prep | Rebuild the same charts every month | Reuse recurring reports and shared views |
The table says it plainly. Manual exports can work, but they keep asking for attention. Automated access gives that attention back.
How I use Baremetrics to simplify Stripe reporting
When I connect Stripe to Baremetrics, I stop treating exports as a separate job. I start treating them as a source of truth that stays visible.
I usually begin with how to connect Baremetrics to Stripe so the setup path is clear. Once the connection is live, Baremetrics pulls subscription data into dashboards that are built for recurring revenue businesses, not general accounting.

That matters because Stripe alone gives me transaction data, while Baremetrics helps me read the business story inside it. I can look at MRR, ARR, churn, LTV, CAC, ARPU, retention, and cohort behavior without stitching together separate exports.
If I need a more warehouse-heavy setup, Stripe’s warehouse export guide shows how to send core data to Snowflake, Redshift, or Databricks. I still like that route for deep analysis. Even so, Baremetrics gives me a faster way to watch the business day to day.
I also like the reporting layer because it keeps the language consistent. When my team agrees on what counts as churn or recurring revenue, the conversation gets shorter. We spend less time debating the file and more time using the numbers.
Where this helps founders, finance teams, and rev ops
This workflow pays off in different ways, depending on who is looking at the data.
For founders, the biggest win is speed. I can open one dashboard and see whether growth is steady, flat, or slipping. I do not need a separate export for every question. If I want to dig into customer value, I use tracking CLV with Baremetrics to understand how long accounts are worth keeping and how that affects pricing or acquisition spend.
For finance teams, the win is consistency. Close week is calmer when revenue data does not need to be rebuilt from scratch. Refunds, cancellations, and payment changes are easier to review when the same system updates them regularly.
For rev ops, the value is segmentation. I can break down performance by plan, cohort, or behavior, then compare how different groups behave over time. If I want to shape a dashboard around those views, I use building a Baremetrics dashboard as a reference point and keep the layout focused on the questions the team asks most.
A few high-value use cases show up again and again:
- Board reporting: I use the same live view each month, so numbers stay aligned.
- Churn review: I can compare cancellation patterns without digging through old exports.
- Pricing checks: I can see whether upgrades, downgrades, and plan changes are helping or hurting revenue.
- Forecasting: I get a cleaner picture of current revenue and churn, which makes hiring and budget talks easier.
Baremetrics also helps when failed payments or missed revenue matter. I do not want to discover those only after a manual review. I want them visible while there is still time to act.
Setting up the workflow without adding more process
I keep the setup simple. If the system gets more complicated than the spreadsheet it replaces, I know I have gone too far.
- I connect Stripe first and confirm the account or accounts I want to track.
- I review the metric definitions with finance, especially revenue, churn, and any plan changes.
- I clean up plan names and customer labels early, because messy labels create fake stories.
- I choose one recurring review rhythm, then use that same dashboard for board prep, finance checks, and rev ops reviews.
That last step matters more than people think. A good dashboard only works if someone looks at it on schedule. Otherwise, it becomes another place where data goes to sleep.
I also keep the raw Stripe export path available for audits and deeper investigation. Baremetrics gives me the day-to-day view. Stripe still holds the underlying records when I need them.
Conclusion
I keep coming back to the same lesson. If a revenue report needs a fresh CSV every time, it is not really a system yet.
Baremetrics helps me turn Stripe data into something my team can check on a schedule instead of rebuilding by hand. That matters when finance wants close data, rev ops wants retention trends, and founders want one clean view of growth.
When Stripe data exports stop being a manual chore, the numbers get easier to trust. The work gets smaller, and the decisions get faster.