When I open a SaaS finance view, I don’t want five tabs and three exports. I want one screen that tells me if the business is growing cleanly or leaking revenue.
A Baremetrics financial dashboard gives me that read faster than spreadsheets ever can. Baremetrics pulls live subscription data into charts, filters, and reports, so I can show revenue health without stitching numbers together by hand. Its subscription analytics software is built for SaaS teams that need a fast view of recurring revenue, churn, and retention.
In this guide, I walk through the metrics I put at the top, the widgets I prioritize, and the way I shape the view for investors, operators, and finance.
Start with the numbers that tell the truth
I never start with a crowded screen. I start with the numbers that explain whether the company is healthy.
The top layer of a SaaS dashboard should answer a few simple questions. Did revenue rise? Did churn hurt us? Are current customers expanding enough to offset losses? For a deeper breakdown of the metrics I watch, I keep my Baremetrics metrics guide close by.
Here are the metrics I put in the first view.
| Metric | Plain-English meaning | Why I care |
|---|---|---|
| MRR | Monthly recurring revenue | It shows the core run rate for the business. |
| ARR | Annual recurring revenue | It helps me frame the business for planning and board meetings. |
| Customer churn | Accounts lost in a period | It tells me if customers are leaving too fast. |
| Revenue churn | Dollars lost from cancels and downgrades | It shows whether big accounts are slipping away. |
| Net revenue retention | How much current customers grow or shrink revenue | Above 100% means the existing base is adding value. |
| ARPU | Average revenue per user or account | It helps me spot pricing or mix changes. |
| LTV | Lifetime value | It helps me judge whether acquisition costs make sense. |
| Failed payments | Billing attempts that did not go through | It reveals revenue at risk before a customer churns. |
I keep customer churn and revenue churn separate. Losing five small plans feels different from losing one enterprise account, and the dashboard should make that difference obvious. I also watch failed payments early, because a card issue can turn into churn if nobody follows up.
Baremetrics helps here because it shows live subscription metrics and lets me filter by plan, country, or UTM tag. That means I can ask a better question than “What happened this month?” I can ask, “What happened in this segment, and why?”
Build the layout around the people who read it
A dashboard works when the right people can scan it fast. I do not build the same view for everyone.
For a clean setup, I often mirror how I configure my Baremetrics dashboard. I keep the top row simple, then use the rows below it to explain movement.
This is the structure I reach for most often.
| Dashboard section | What I place there | Who reads it first |
|---|---|---|
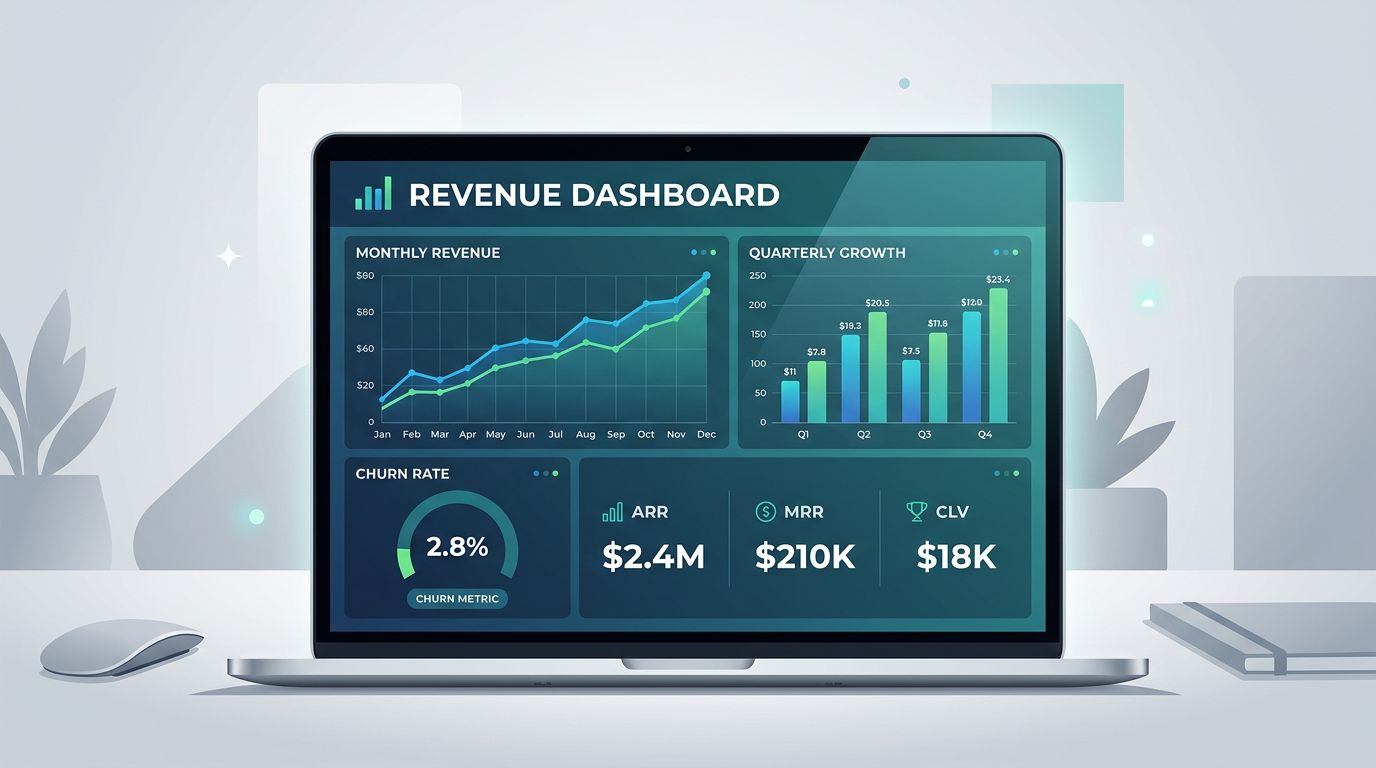
| Top row | MRR, ARR, net new MRR | Founders and executives |
| Trend row | MRR over time, churn, expansion, contraction | Finance and operators |
| Segment row | Plan, region, source, or cohort filters | Growth and product teams |
| Risk row | Failed payments, downgrades, cancellations | Finance and support |
| Activity feed | Trials, upgrades, renewals, churn events | Everyone who needs context |


I like this layout because it keeps the first question simple. The top row says whether the business is moving in the right direction. The lower rows explain what pushed the line up or down.
Baremetrics also supports multiple dashboards, which makes it easier to separate board reporting from day-to-day work. I can keep one view for executives, one for finance, and one for growth. That saves me from cramming every metric into a single screen.
If a metric needs a long explanation every week, it probably doesn’t belong in the top row.
Use the dashboard for investors, executives, and finance
The same numbers can answer different questions. I shape the dashboard to match the audience.
For investors, I want a short story. I lead with MRR, ARR, net new MRR, churn, and net revenue retention. Then I add a short note about what changed during the period. If we raised prices, launched a feature, or ran a campaign, I annotate that in the same timeline so the numbers have context.
For executives, I want speed. I need a view that shows whether expansion is outrunning churn, whether one plan is carrying too much weight, and whether a billing issue is becoming a revenue problem. Baremetrics makes that easier because I can export reports and push them to Slack or email, which keeps the same numbers moving through leadership updates.
For finance, I care about control. I want failed payments, cancellations, downgrades, and cohort trends in one place. I also want to see where monthly revenue is concentrated. If one plan or one acquisition channel drives too much of the line, I need that visible before the quarter closes.
I use a simple rule here. If a person can act on the number, the dashboard should show it. If they cannot act on it, I move it down a level or out of the main view.
Baremetrics’ own SaaS dashboard examples reflect that same idea. The best view is not the busiest one. It is the one that answers the next question before the meeting gets awkward.
Keep the data honest and useful
A clean dashboard starts with clean billing data. If the source is messy, the screen will lie to you with perfect charts.
I begin by checking which billing system feeds the dashboard, then I confirm that the subscription data matches reality. Baremetrics works with common billing tools such as Stripe and Recurly, so I make sure the plan names, currencies, and customer states are mapped the way finance expects them.
After that, I keep the dashboard honest with a few habits.
- I assign one owner to each key metric, so MRR, churn, and ARPU mean the same thing every week.
- I add notes for pricing changes, product launches, and campaign pushes, so trend shifts are easy to explain.
- I compare plan-level views against billing exports when a number looks off.
- I check failed payments and downgrades before I send board reporting.
- I keep one dashboard for daily reading and another for monthly reporting.
That last point matters more than most teams think. A daily dashboard should help me spot motion. A board dashboard should help me explain performance. Those are not the same job.
I also like to use segment filters sparingly. Too many filters make a dashboard feel clever and slow. The best setup usually starts with plan, region, source, and cohort. That is enough to answer most revenue questions without turning the view into a maze.
The widgets I would never leave out
If I had to build the dashboard from scratch today, I would prioritize these sections first.
- MRR and ARR go at the top because they frame the whole business.
- Net new MRR sits beside them because it shows whether growth is coming from new sales or existing customers.
- Churn and contraction belong in the next row because they show where revenue slipped.
- Expansion MRR needs its own spot because it tells me whether current accounts are growing.
- Failed payments stay visible because billing issues often show up before churn does.
- Segment filters for plan, country, and acquisition source help me spot patterns faster.
- Activity feed gives me the events behind the curve, which makes meetings easier.
This is the part where Baremetrics feels practical rather than decorative. It gives me a live view of the business, and the filters help me move from headline numbers to the reason behind them.
I still keep a wider analytics stack around it when I need product or funnel data. Baremetrics is the finance lens. It is not my only lens.
What I watch before I share the dashboard
I do one last pass before I show the dashboard to anyone else. I ask three questions.
First, can someone read the top row in under ten seconds? If not, I cut it back.
Second, does each number have a clear owner? If a metric has no owner, it tends to drift.
Third, can I explain the latest shift without hand-waving? If not, I add context notes or segment the view again.
That habit saves time in board meetings and weekly reviews. It also keeps the dashboard useful when the business changes fast. A strong view should survive a new pricing plan, a channel shift, or a billing issue without falling apart.
Conclusion
A SaaS dashboard does its best work when it feels plain and honest. The right view shows MRR, churn, retention, and expansion without forcing people to hunt for the story.
That is why I like building a Baremetrics financial dashboard around clear top-line metrics, focused segments, and a clean path from revenue movement to explanation. When the screen answers the hard questions quickly, the numbers stop feeling like noise.
A good dashboard does not need to impress anyone. It needs to tell the truth fast.