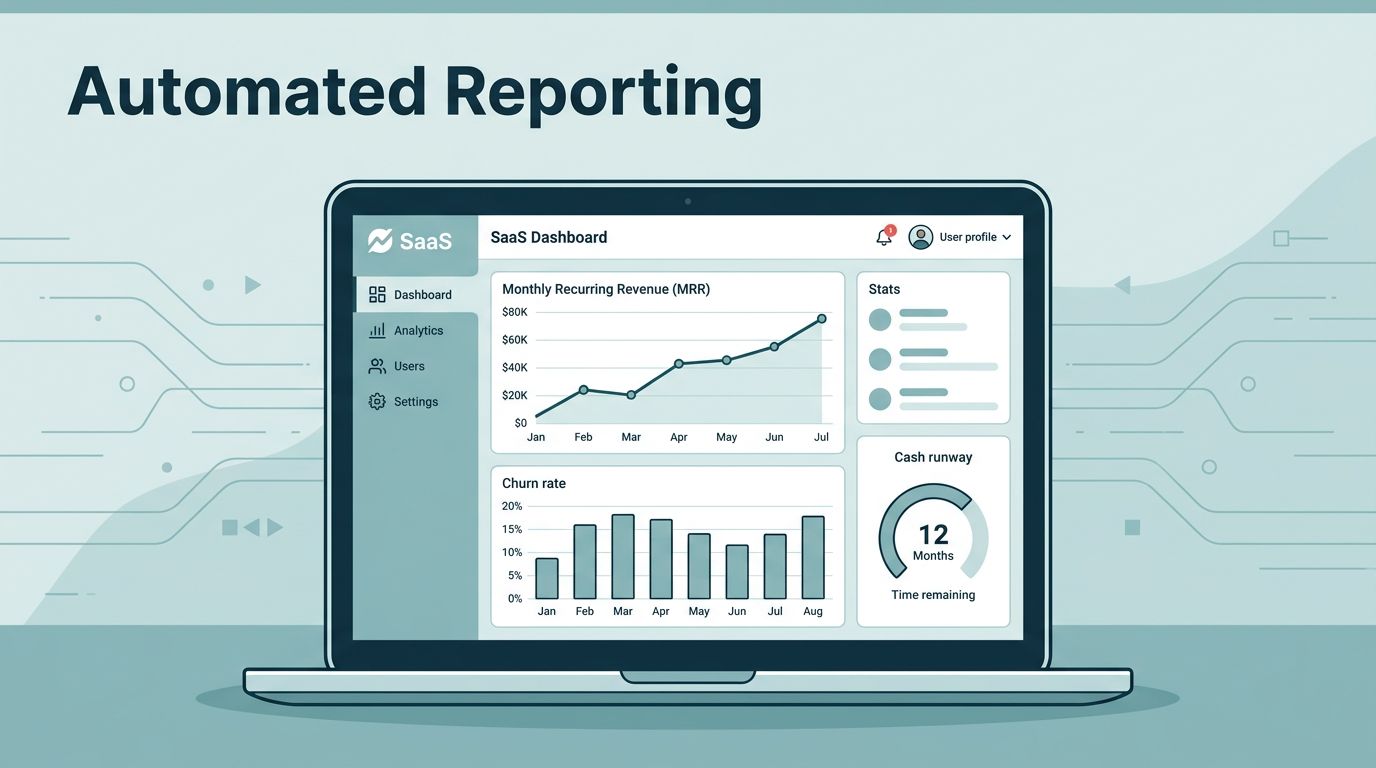
You know the drill. Investors want fresh numbers on your SaaS business every month. They ask for MRR trends, churn rates, and cash runway updates. Manual spreadsheets take hours and invite errors.
I faced this as a SaaS founder. Chasing data from Stripe, calculating NRR by hand, and formatting decks ate my time. Baremetrics changed that. It pulls billing data, crunches metrics, and sends reports automatically.
Now I focus on growth, not data wrangling. Let me show you my setup.
Why Manual Reporting Kills Your Momentum
I used to spend Fridays building investor packs. Pull MRR from Stripe. Tally churn. Guess at LTV. One wrong formula, and trust erodes.
Investors spot inconsistencies fast. They compare your ARR to benchmarks. If numbers wobble, questions pile up. Automation fixes this. Baremetrics syncs data in real time. No more copy-paste mistakes.
Consistency builds credibility. I send the same metrics monthly. Investors see trends clearly. Growth looks steady because it is. Plus, I spot issues early, like rising churn.
Tools like Baremetrics handle the heavy lift. They connect to your billing system. Metrics update live. You gain hours back each week.
Key Metrics Investors Demand from SaaS
Investors zero in on a core set. MRR tops the list. It shows recurring revenue now. ARR scales that to yearly. Both reveal your engine’s power.
Churn matters next. High numbers signal leaks. I track revenue churn and logo churn separately. Net revenue retention, or NRR, tells the full story. Do expansions offset losses? Investors love NRR over 100%.
LTV and CAC pair up. Lifetime value divided by acquisition cost shows efficiency. Cash runway predicts survival. Growth trends tie it together. Quick ratio measures sustainable expansion.


Baremetrics tracks these out of the box. As of May 2026, it calculates LTV as ARPU over churn rate. Forecasts use history for cash runway. Benchmarks compare you to peers. I share these views directly. No exports needed.
For deeper dives, check Baremetrics’ full metrics list. It covers 28+ items, including cohorts.
Setting Up Baremetrics for Automated Reporting
Start simple. Sign up for Baremetrics. Plans begin at $75 monthly for Launch. Connect Stripe with one click. Data backfills automatically.
I pick key metrics first. MRR, ARR, churn, NRR. Enable Recover for failed payments. It cuts involuntary churn by 40-60%. Cancellation Insights tags reasons for exits.

Set email reports next. Daily MRR summaries go to Slack. Weekly churn alerts hit my inbox. Monthly packs include ARR, LTV, CAC, and runway. Schedule them for investor dates.
Integrations seal it. Link to HubSpot for CAC data. Slack for team pings. API pulls custom views. For revenue schedules, I use Baremetrics to simplify SaaS revenue recognition, as in this setup.
Test with a trial month. Compare outputs to your sheets. Tweak segments by plan or region. Data flows clean now.
Building Investor-Focused Dashboards
Dashboards make metrics pop. Baremetrics Smart Dashboards build in seconds. Drag MRR, churn, NRR. Add growth trends.
I create one view for investors. Top row: MRR and ARR cards with trends. Middle: NRR and churn lines. Bottom: LTV, CAC, runway forecast. Benchmarks show if you’re ahead.

Customize cohorts. See if monthly plans churn faster. Expansion MRR highlights upsell wins. For MRR accuracy, follow my close process.
Share links securely. Investors log in or get PDFs. No more email chains. Alerts notify on dips, like cash runway under 12 months.
This setup mirrors executive dashboards I build. Teams act on data, not guess.
Delivering Recurring Reports with Precision
Automation shines in delivery. Email reports bundle metrics. Include quick ratio for growth health. Attach charts for trends.
I format concise. One page: Current MRR, delta, NRR, churn. Next: LTV:CAC ratio, runway months. Trends over six months. Bullet risks and wins.
For exports, use Baremetrics data exports. CSV for MRR history or breakdowns. Perfect for diligence.
API extends reach. Pull to Google Sheets for decks. Slack posts daily pulses. Consistency keeps stakeholders looped in.
Track NRR monthly, as I do here. It proves your base expands.
Avoiding Pitfalls in Baremetrics Investor Reporting
Data lags kill trust. Always freeze a reporting date. Validate against Stripe.
Segments matter. Churn looks low overall? Check annual vs. monthly. Use cohorts for truth.
Overload decks. Stick to 8-10 metrics. Investors skim.
Costs add up. Growth plan at $255 unlocks more integrations. Weigh against time saved.
For failed payments, automate recovery early. It boosts MRR, as in my Recover playbook.
Benchmarks help, but own your story. Explain outliers.
Conclusion
Baremetrics turns investor reporting into a routine. I pull live MRR, NRR, and runway without sweat. Dashboards and emails keep everyone aligned.
Automation frees you to build. Stakeholders get accurate views. Your focus shifts to fixes, like churn sources.
Try the free trial. Connect data today. Watch momentum build.