Baremetrics Pricing Metrics: How I Read SaaS Pricing Performance
Pricing problems rarely announce themselves. They show up as flat ARPU, a growing pile of downgrades, or discounts eating margin. Baremetrics pricing metrics give a way to spot each pattern before revenue suffers. This guide shows which Bar...
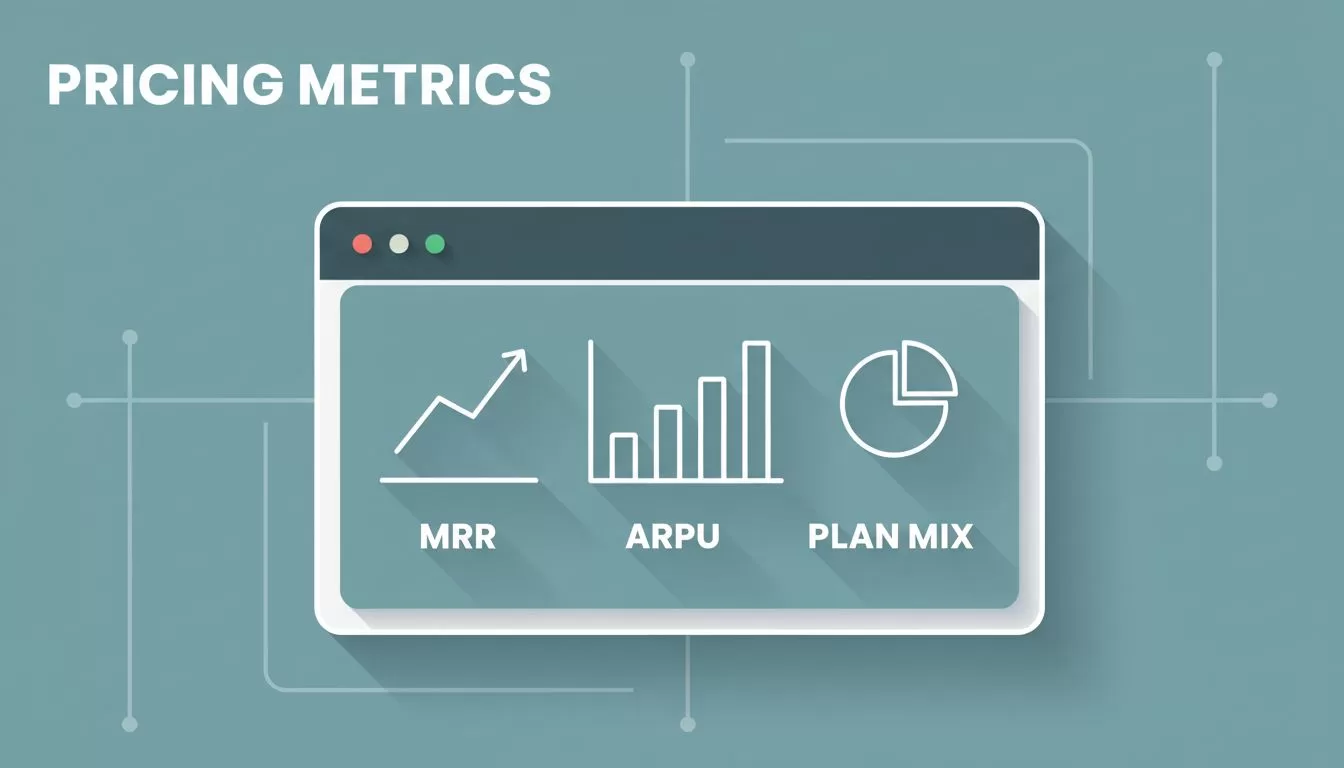
Pricing problems rarely announce themselves. They show up as flat ARPU, a growing pile of downgrades, or discounts eating margin. Baremetrics pricing metrics give a way to spot each pattern before revenue suffers.
This guide shows which Baremetrics metrics inform pricing decisions, how the formulas work, how to compare them, and which signals point to a change in price or packaging. Definitions come from Baremetrics pages. Confirm current plan details on the Baremetrics pricing page.
The core metrics behind pricing decisions
The Baremetrics metrics overview lists 28 tracked subscription metrics. Four of the metrics deserve a first look in any pricing review: MRR, ARPU, plan mix, and churn.
| Metric | Baremetrics definition | Pricing question answered |
|---|---|---|
| MRR | Recurring revenue normalized to a monthly amount | Is revenue growing, and from where? |
| ARR | MRR times 12, assuming no new customers, no churn, and no expansion | What is the yearly run rate? |
| ARPU | MRR divided by active customers | Is each customer worth more or less over time? |
| LTV | Average monthly recurring revenue per customer divided by user churn rate | Which segments earn the most over a lifetime? |
| Customer churn | Customers cancelled in the last 30 days divided by active customers 30 days ago, times 100 | How many accounts leave? |
| Revenue churn | MRR lost to downgrades and cancellations in the last 30 days divided by MRR 30 days ago, times 100 | How much money leaves? |
| Net revenue churn | (Churned MRR minus Expansion MRR) divided by starting MRR 30 days ago, times 100 | Do upgrades cover the losses? |
MRR is the headline number, but MRR alone cannot judge pricing. Rising MRR with flat ARPU means growth comes from volume, not value. The business adds customers but not revenue per customer. Low-priced plans, heavy discounts, or a weak mid tier often explain this pattern.
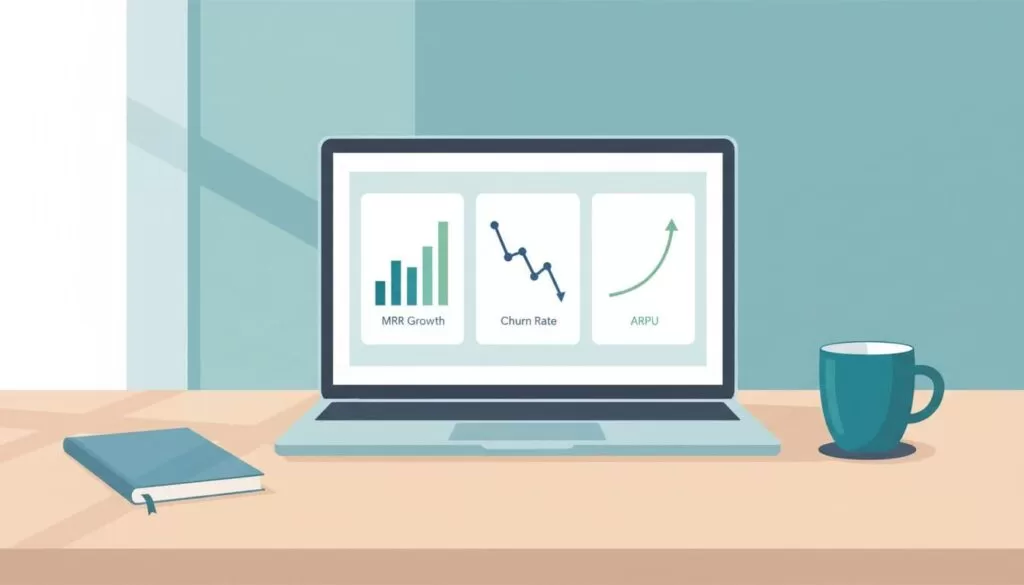
Read plan mix before changing a price
Plan mix shows the share of customers on each tier. Growth concentrated in the cheapest plan raises one question: does the product give customers a reason to upgrade later? A crowded entry tier with little expansion signals a packaging problem more than a price problem.
Baremetrics offers segmentation for this work. The pricing page lists autogenerated segments on the Launch plan and unlimited segmentation on the Growth plan. Segments let a team compare plan performance by signup date, customer group, or plan instead of staring at one blended average.
Compare cohorts before and after any pricing change. If a newer cohort shows lower ARPU and higher churn, the new packaging may weaken perceived value. If the newer cohort shows higher ARPU with similar churn, the change worked.
Discounts need extra care. A promotion can fill the funnel and still weaken pricing power. Read ARPU with the discount in mind. The Baremetrics articles on key metrics for value-based pricing and price analysis for SaaS tie pricing to customer behavior in the same way.
Customer churn versus revenue churn
Customer churn counts accounts. Revenue churn counts money. The two numbers can move in opposite directions.
Ten small accounts may cancel while revenue churn stays calm. One large account may downgrade while customer churn looks fine. Each case calls for a different pricing response.
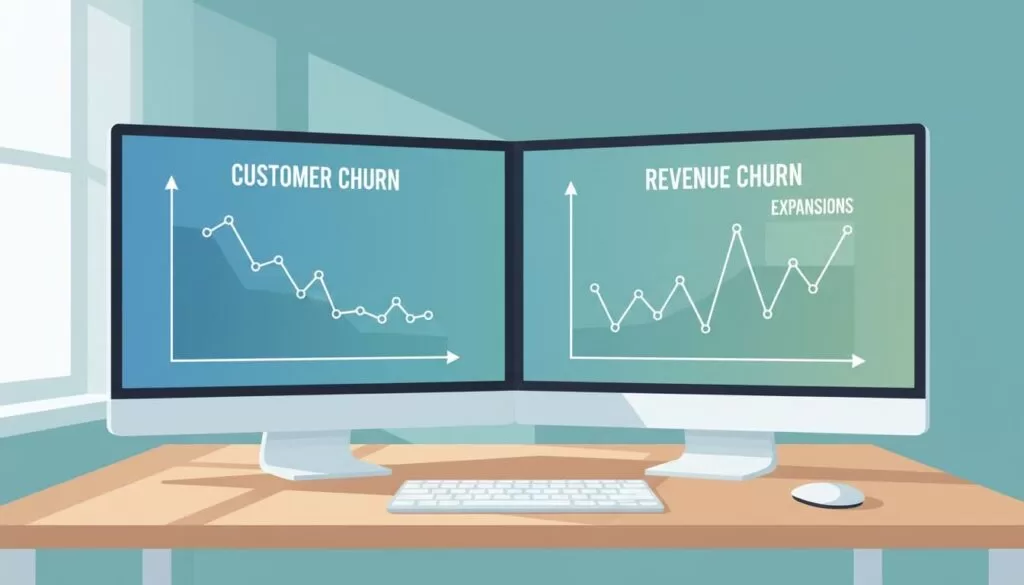
Compare churn with upgrades, downgrades, and expansion revenue. Net revenue churn captures the balance. When expansion exceeds churned MRR, net revenue churn turns negative, and the existing base grows. When customer churn rises but net revenue retention holds, larger customers may still be expanding. In this case, ask who is leaving before cutting any price. The lowest tier may attract poor-fit buyers. A trial promise may oversell the product.
Downgrades deserve special attention. A downgrade wave usually means customers still want the product but not at the current price or feature boundary. Possible causes include a missing middle tier, unclear packaging, or usage limits which feel punitive. The guide on Baremetrics net revenue retention shows how expansion and churn combine in one number.
Separate billing failures from price resistance
Not every lost dollar signals a pricing problem. Failed payments reduce revenue when cards expire or banks decline charges. Voluntary cancellations reflect a customer decision. Treat the two separately.
Baremetrics sells two add-ons for the split. The pricing page lists Payment Recovery at $129 per month and Cancellation Insights at $129 per month. Recover handles reminders and card update flows for failed payments. Cancellation Insights collects reasons at the point of cancellation and ties each reason to lost revenue. Confirm both prices on the official pricing page before budgeting, because the page shows more than one set of plan prices.
Related guides cover each add-on in detail. See Baremetrics dunning emails and Baremetrics cancellation insights.
A repeatable pricing analysis workflow
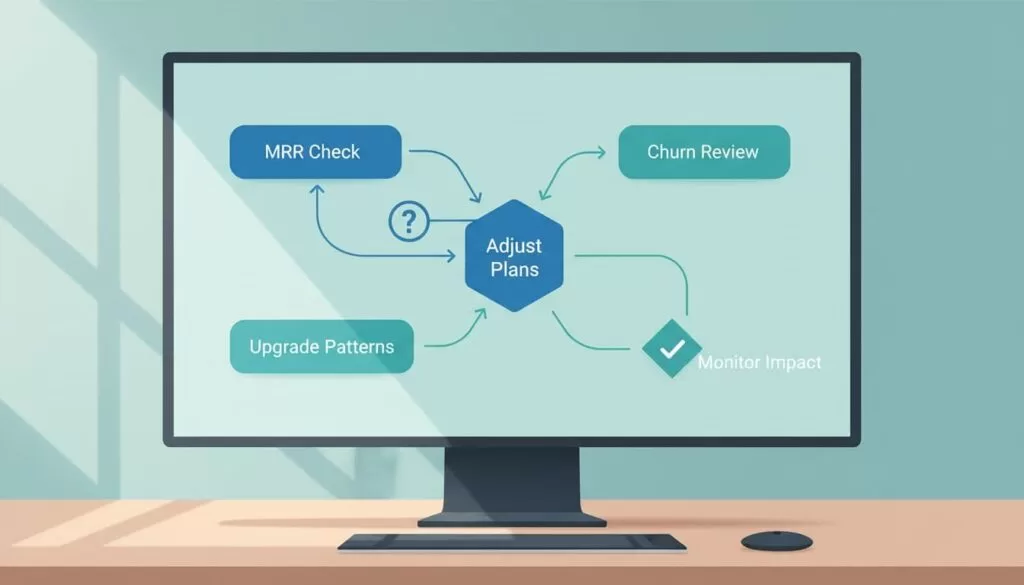
A fixed sequence keeps the analysis honest. Follow these steps for each review.
- Check MRR quality. Split MRR movement into new revenue, expansion, and contraction. Heavy expansion with weak new revenue suggests the price works for existing customers but not for prospects.
- Segment by plan and cohort. Compare customers who joined before and after the last pricing change.
- Compare churn types with downgrades. Review customer churn, revenue churn, and downgrades together. Downgrades rising before churn give early warning.
- Separate payment friction from price resistance. Place failed payments in one bucket and voluntary cancellations in another.
- Estimate the effect of a change. Use cohort trends and, on plans with scenario tools, a forecast. The pricing page lists Scenario Planning on the Scale plan.
- Change one variable at a time. Move one price, one limit, or one discount, then measure the next cohort.
Baremetrics frames pricing as a loop in its article on price optimization in SaaS. Measure, change, and measure again.
Patterns and the decisions they suggest
| Pattern in the data | Likely cause | Next move to test |
|---|---|---|
| MRR up, ARPU flat | Growth from low-value plans or discounts | Review entry tier limits and discount rules |
| Strong upgrades, low downgrades | Room to move value into the middle plan | Tighten the entry plan or sharpen mid-tier features |
| Customer churn flat, revenue churn up | Large accounts shrinking or discount-heavy renewals | Segment by account size and renewal terms |
| Most customers on the cheapest plan, low expansion | Weak reason to upgrade | Review feature gates and usage limits |
| Downgrades rise before churn | Price or feature boundary feels wrong | Test a new middle tier |
LTV helps settle hard calls. When higher-priced cohorts show better retention and stronger expansion, the price may filter for better-fit buyers. The Baremetrics article on predictive analytics for SaaS lifetime value connects retention quality to future revenue.
Treat every pattern as a hypothesis. Data suggests a cause. A test confirms the cause.
Build a pricing review calendar
Pricing work improves with a schedule. A quarterly review fits most subscription businesses. Smaller teams can start with one review every six months and tighten the cadence later.
- Before the review. Export MRR, ARPU, plan mix, and the three churn metrics for the last two periods.
- During the review. Compare plan cohorts, list the discounts in use, and note any packaging change since the last review.
- After the review. Write one hypothesis, one test, and one date to check results.
Keep a short log. Each entry holds the date, the change, the expected effect, and the measured effect. After a year, the log shows which levers moved revenue and which moved nothing.
Questions to ask before raising prices
A price increase carries risk. Run through a short checklist first.
- Does ARPU lag behind the value customers report?
- Do customers on the top plan show the lowest churn and the strongest expansion?
- Do downgrades stay rare at the current tier boundaries?
- Is customer churn low because the product fits, or because most customers sit on the cheapest plan?
- Can the team measure the next cohort cleanly, without a second change mixed in?
Yes answers to the first three questions support a test. A no to the last question means the test must wait. Mixed changes produce mixed lessons.
Mistakes to avoid in pricing analysis
Three errors appear often. First, teams read blended averages and miss segment differences. Second, teams change price and packaging in the same month, so no one can tell which change worked. Third, teams treat a quiet month as proof of success. Churn can lag a price change, so wait for a full cohort before declaring a result.
FAQ
Which Baremetrics metrics matter most for pricing?
Start with MRR, ARPU, plan mix, customer churn, revenue churn, and net revenue churn. Add LTV when comparing segments.
How does Baremetrics calculate ARPU?
Baremetrics defines ARPU as MRR divided by active customers.
What is the difference between revenue churn and net revenue churn?
Revenue churn counts MRR lost to downgrades and cancellations. Net revenue churn subtracts expansion MRR from churned MRR, so upgrades offset losses.
Do I need a specific plan for segmentation?
The Baremetrics pricing page lists autogenerated segments on Launch and unlimited segmentation on Growth. Check the page for current plan contents.
How do I tell a billing problem from a pricing problem?
Look at the cause of lost revenue. Failed payments point to billing. Voluntary cancellations and downgrades point to value or price. Recovery tools and cancellation reasons help split the two.
Conclusion
Baremetrics pricing metrics work best as a set. MRR shows growth, ARPU shows revenue per customer, plan mix shows where customers sit, and churn types show where money leaves. Read the relationships, not single charts.
Change one variable at a time and compare cohorts. Verify current plan features and add-on prices on the official Baremetrics pricing page before building a process around them.
