I watch the saas quick ratio when I want a clean read on revenue quality. It tells me whether new and expanded revenue are filling the bucket faster than churn and contraction are draining it.
In Baremetrics, I do not treat the number as magic. I treat it as a ratio built from MRR movement, and I check the parts before I trust the headline.
That matters when billing data is messy, when reactivations blur the picture, or when someone wants one number for a board deck. I use a short process to calculate it and spot the traps early.
What Baremetrics counts as inflow and outflow
The version I use is simple:
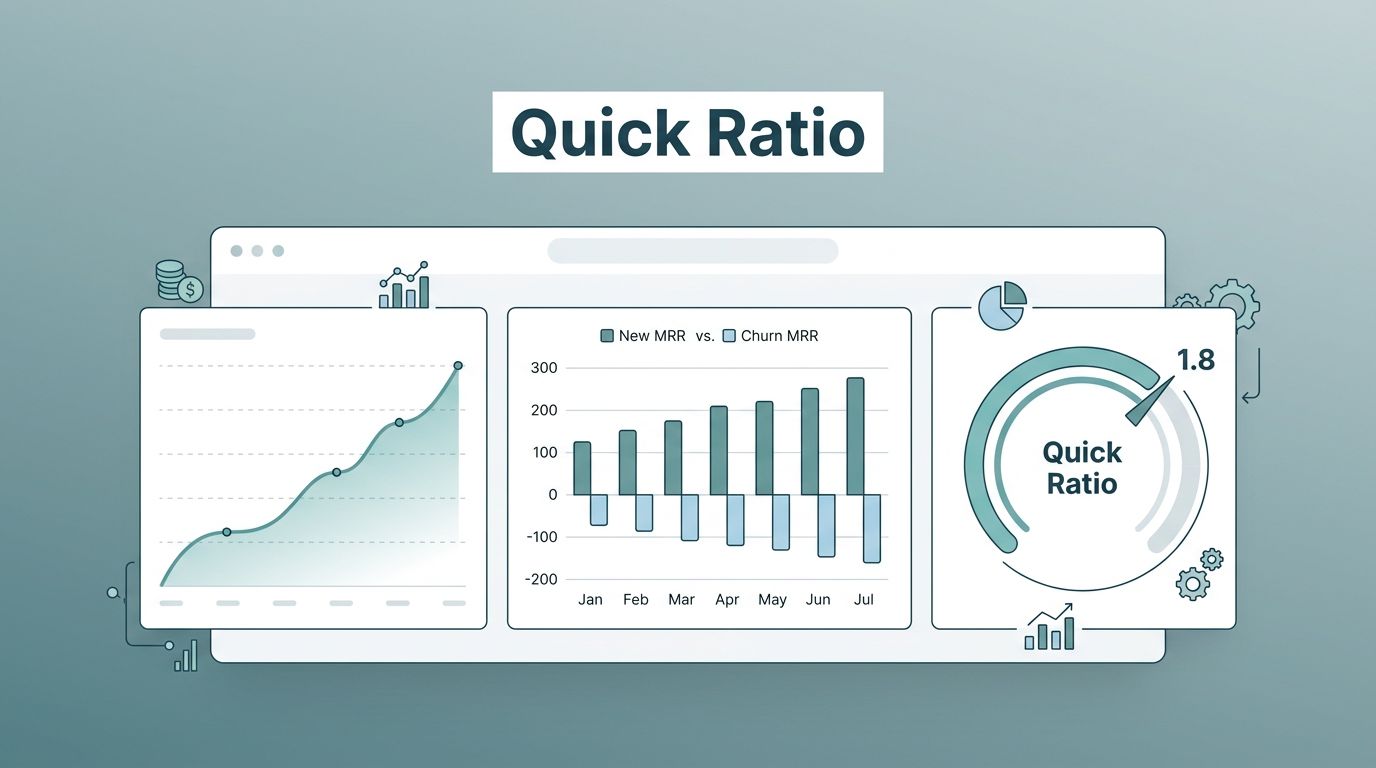
SaaS quick ratio = (New MRR + Expansion MRR) ÷ (Contraction MRR + Churned MRR)
That formula matches the plain-English breakdown in Stripe’s quick ratio guide and the fuller explanation in Wall Street Prep’s formula breakdown. In practice, Baremetrics usually shows the MRR movement buckets, then rolls them into the ratio for me.
I keep one assumption in mind. Some Baremetrics views may include Reactivation MRR in the numerator. If I use that version, I label it clearly, because it changes the result.
New MRR and expansion MRR are the inflows. Contraction MRR and churned MRR are the outflows. Reactivation, when it appears, sits closer to inflow than loss, but I only fold it in when I want the dashboard to match that rule across every report.
My step-by-step calculation flow in Baremetrics
I start with the billing source, then I move to the ratio. That order matters, because a clean formula cannot save dirty source data.
- I connect the billing system first, usually Stripe, Braintree, or Recurly.
- Next, I open the Baremetrics view that shows MRR movement or the quick ratio itself.
- Then I check the components behind the number, including New MRR, Expansion MRR, Contraction MRR, and Churned MRR.
- If Baremetrics shows the related metrics instead of a single labeled calculation, I rebuild the ratio myself from those buckets.
- Finally, I lock the date range to one month so I do not mix partial periods.

For a simple example, I might see these numbers in one month:
- New MRR: $45,000
- Expansion MRR: $15,000
- Contraction MRR: $12,000
- Churned MRR: $8,000
That gives me this math:
($45,000 + $15,000) ÷ ($12,000 + $8,000) = $60,000 ÷ $20,000 = 3.0
If Baremetrics also includes $5,000 of reactivation MRR in the numerator, the ratio becomes 3.25. I only use that version when I know the same rule is applied everywhere else.
If I cannot explain the numerator and denominator in one sentence, I do not trust the ratio yet.
How I read the quick ratio after the calculation
The number only matters when I put it beside the rest of the story. A ratio of 1 means growth and loss are equal. That is a thin line, and it tells me the business is treading water.
When the ratio climbs above 4, I usually feel better about growth efficiency. Still, I do not stop there. A high ratio can hide a small base, and a modest ratio can still be fine in a month with heavy expansion or seasonal churn.
I keep the number next to the rest of the subscription picture in my broader SaaS metrics dashboard, because one metric rarely tells the full story. I also cross-check it against my SaaS metrics checklist for founders so I do not miss the supporting numbers.
Here is how I read it in plain language:
- A higher ratio means growth is cleaner and more efficient.
- A ratio near 1 means gains and losses are nearly balanced.
- A low ratio means I need to look at churn, pricing, or onboarding.
- A strong ratio with weak net new MRR still deserves a closer look.
The quick ratio is a flashlight, not a verdict. It helps me see where the revenue is coming from and where it leaks out.
When the numbers do not match the books
Mismatch problems usually come from the source data, not the ratio itself. I check the easy failures first, because they waste the most time.
- I confirm the date range in Baremetrics matches the month I am modeling.
- I check whether refunds, credits, taxes, or annual prepaids are affecting MRR movement.
- I look for subscription changes that created duplicate customers or split plans.
- I verify whether reactivation MRR is counted in the numerator.
- I compare subscription events with revenue recognition, because booked revenue and MRR can tell different stories.
If the ratio still looks off, I export the movement data and recalc it in a spreadsheet. That gives me a second view and helps me catch a broken mapping between the billing feed and Baremetrics.
The common pattern is simple. If churn looks too high, I search for canceled subscriptions that were paused, migrated, or reactivated. If expansion looks too low, I check whether upgrades landed outside the date window. Either way, the fix usually sits in the data trail.
Conclusion
When I calculate the saas quick ratio in Baremetrics, I start with the movement buckets, not the headline number. That keeps the math honest and makes the result easier to defend.
The real value is not the ratio alone. It is the habit of checking what went in, what leaked out, and whether the dashboard matches the business reality I care about.