

Navigating Stripe billing pricing in 2026 seems straightforward until I translate those numbers into a monthly operational budget. The public headline is 0.7% of billing volume on the pay-as-you-go pricing model, or a flat $620 per month on an annual plan, but those figures are merely the starting points. Once I factor in the costs
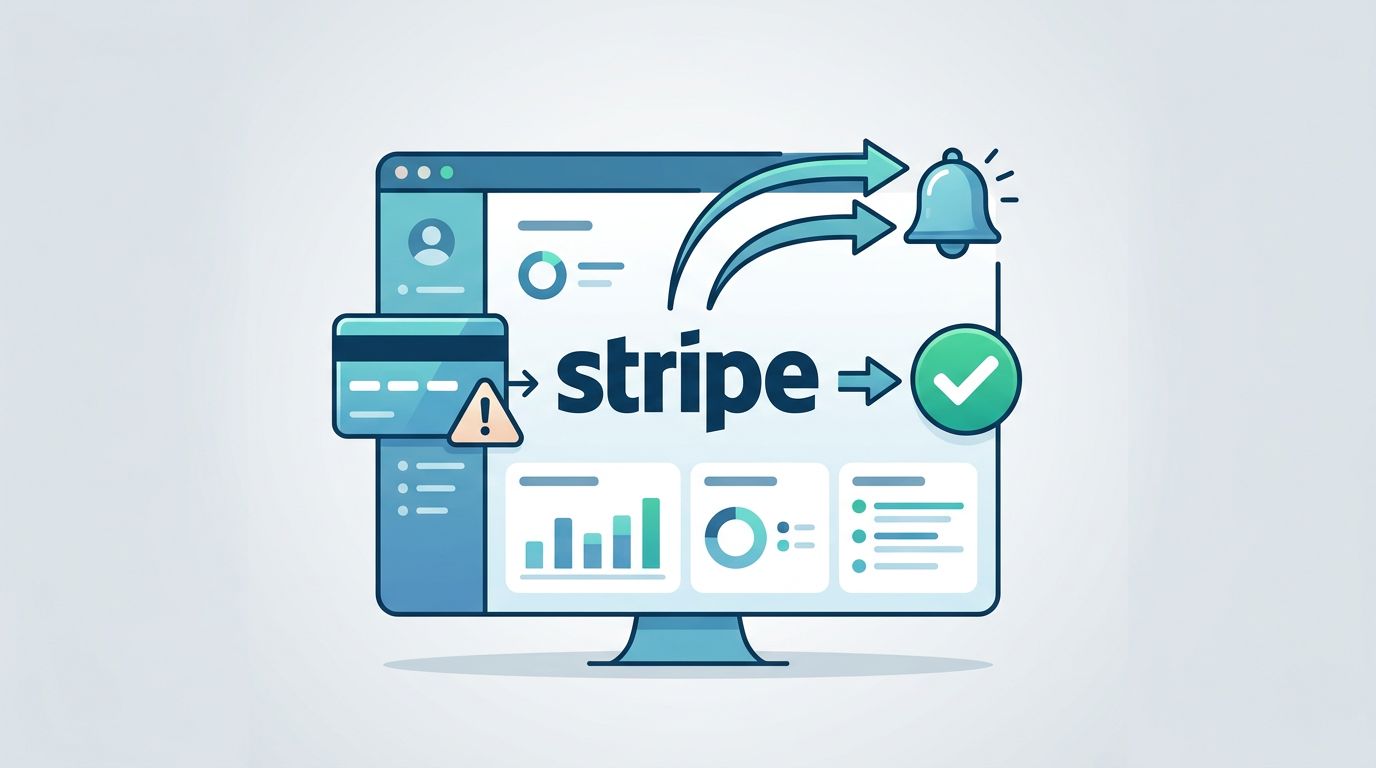
A failed Stripe charge can look small on a dashboard and still cost real money. One missed renewal, one ignored email, and a customer who meant to stay slips into involuntary churn. I use Baremetrics Recover when I want that gap handled without a manual chase. The charge fails, the follow-up starts, and the customer
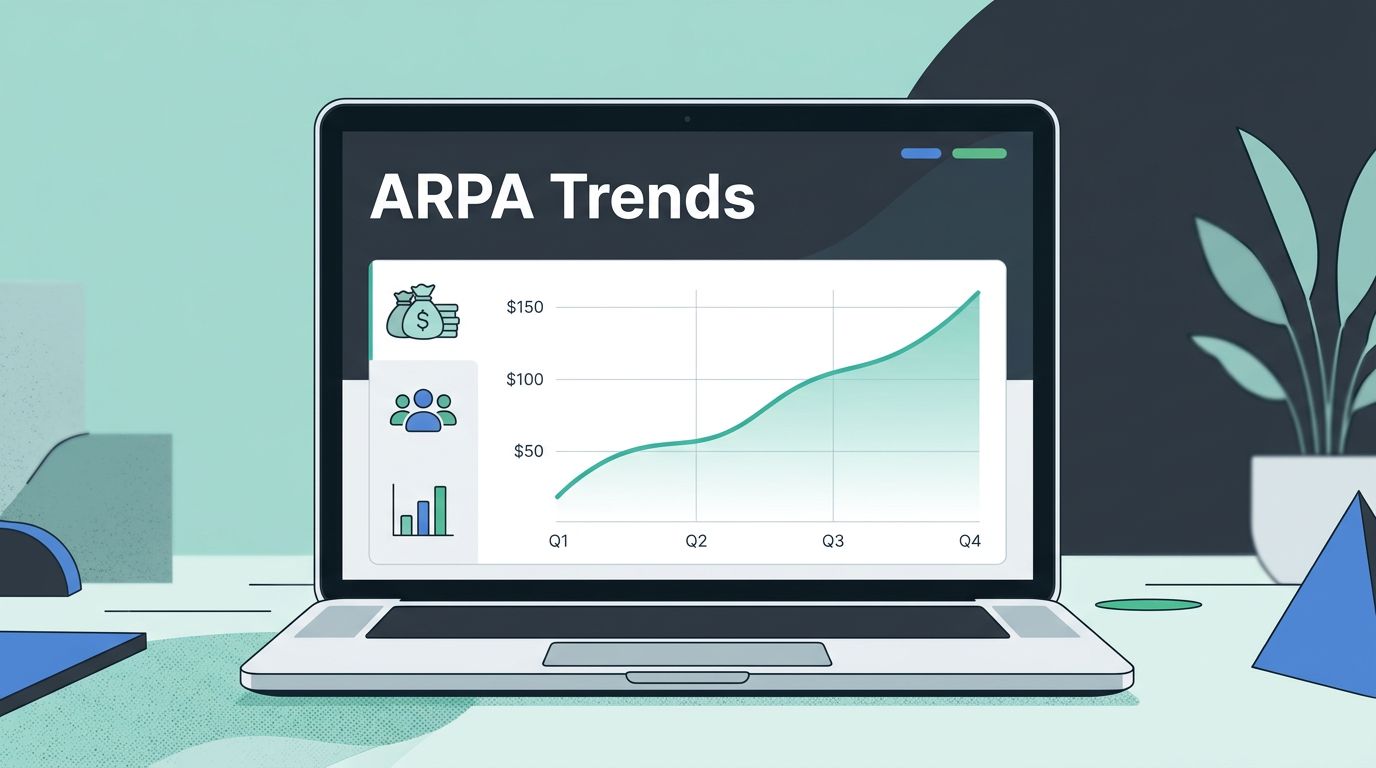
ARPA moves faster than most founders expect. One pricing change, one enterprise deal, or one wave of discounting can bend the line in a single month. I watch ARPA growth trends because the average tells me whether my revenue base is getting stronger or just getting bigger. If the number rises for the right reason,
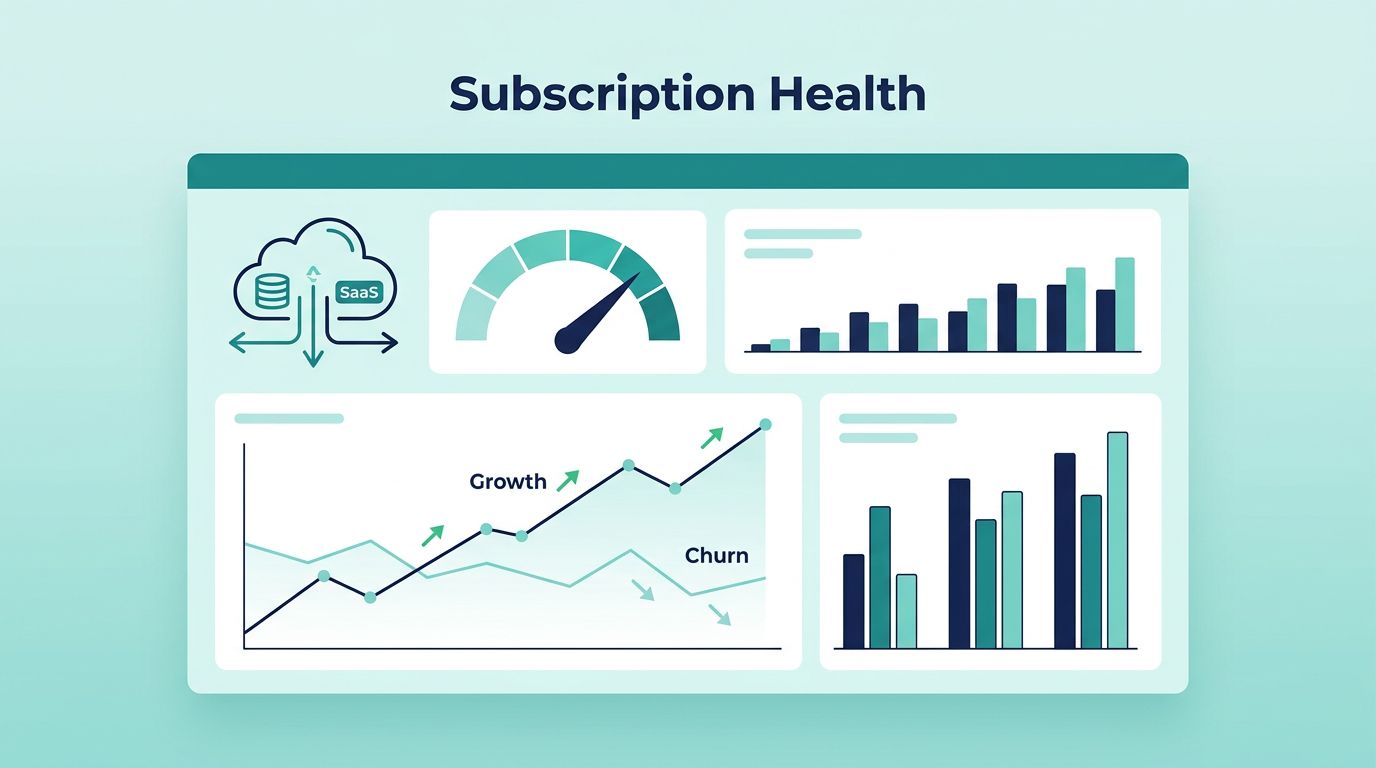
Recurring revenue can look healthy while the base leaks in quiet places. A few new signups can hide churn, failed payments, or a weak trial funnel. I use Baremetrics subscription health checks to see the real story behind the topline, then I act before the board deck gets messy. I start with the numbers that
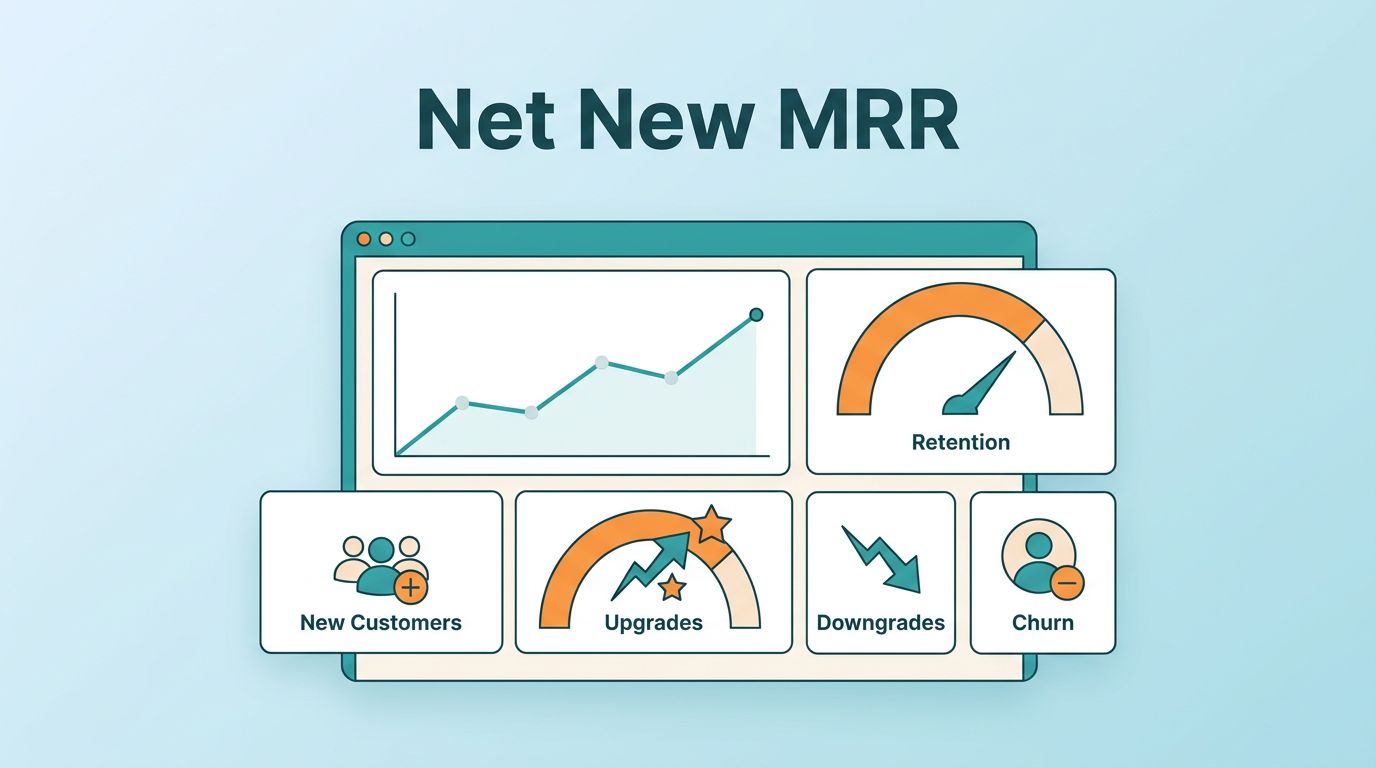
Net new MRR tells me whether my SaaS business actually grew this month, or just looked busy. A healthy top line can still hide churn, downgrades, and weak retention. I use Baremetrics to separate the real drivers, so I can see where the money came from and where it leaked out. That gives me a
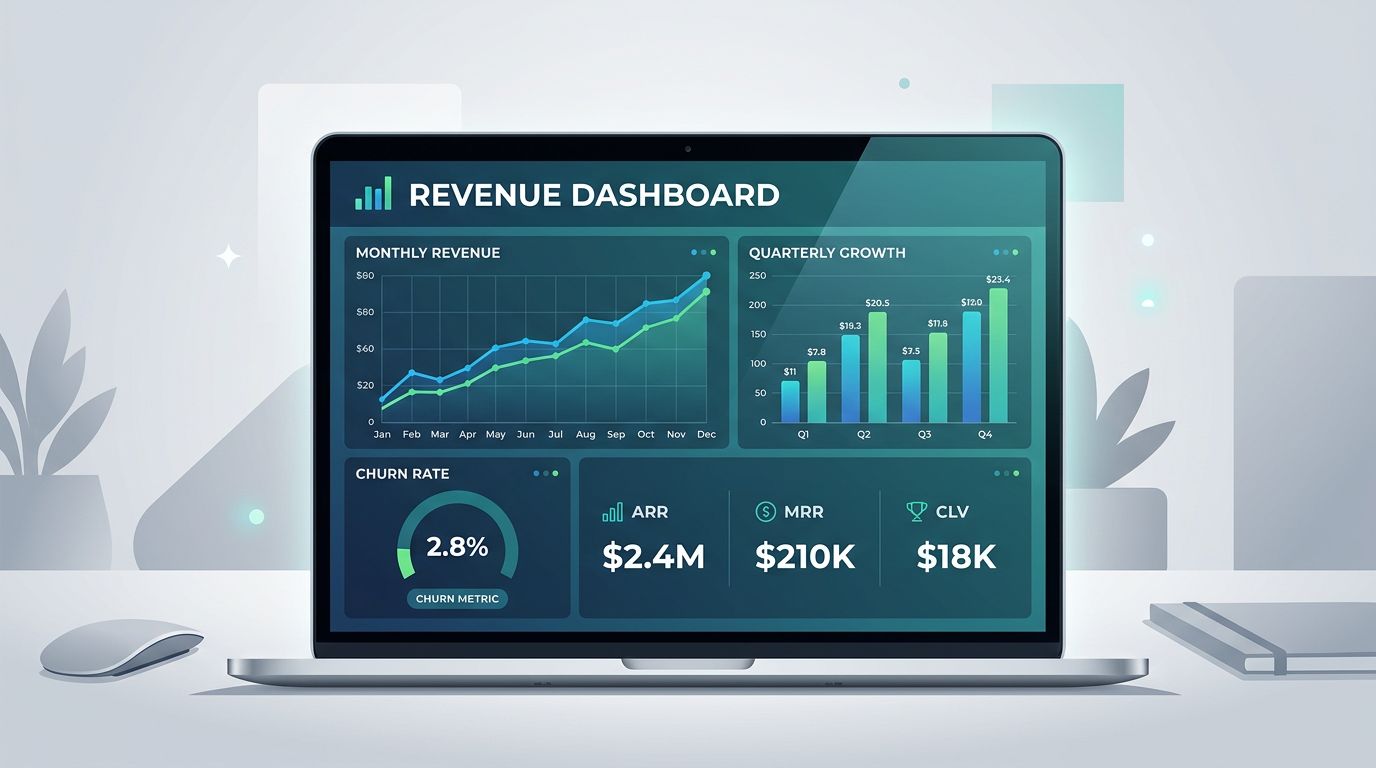
When I open a SaaS finance view, I don’t want five tabs and three exports. I want one screen that tells me if the business is growing cleanly or leaking revenue. A Baremetrics financial dashboard gives me that read faster than spreadsheets ever can. Baremetrics pulls live subscription data into charts, filters, and reports, so
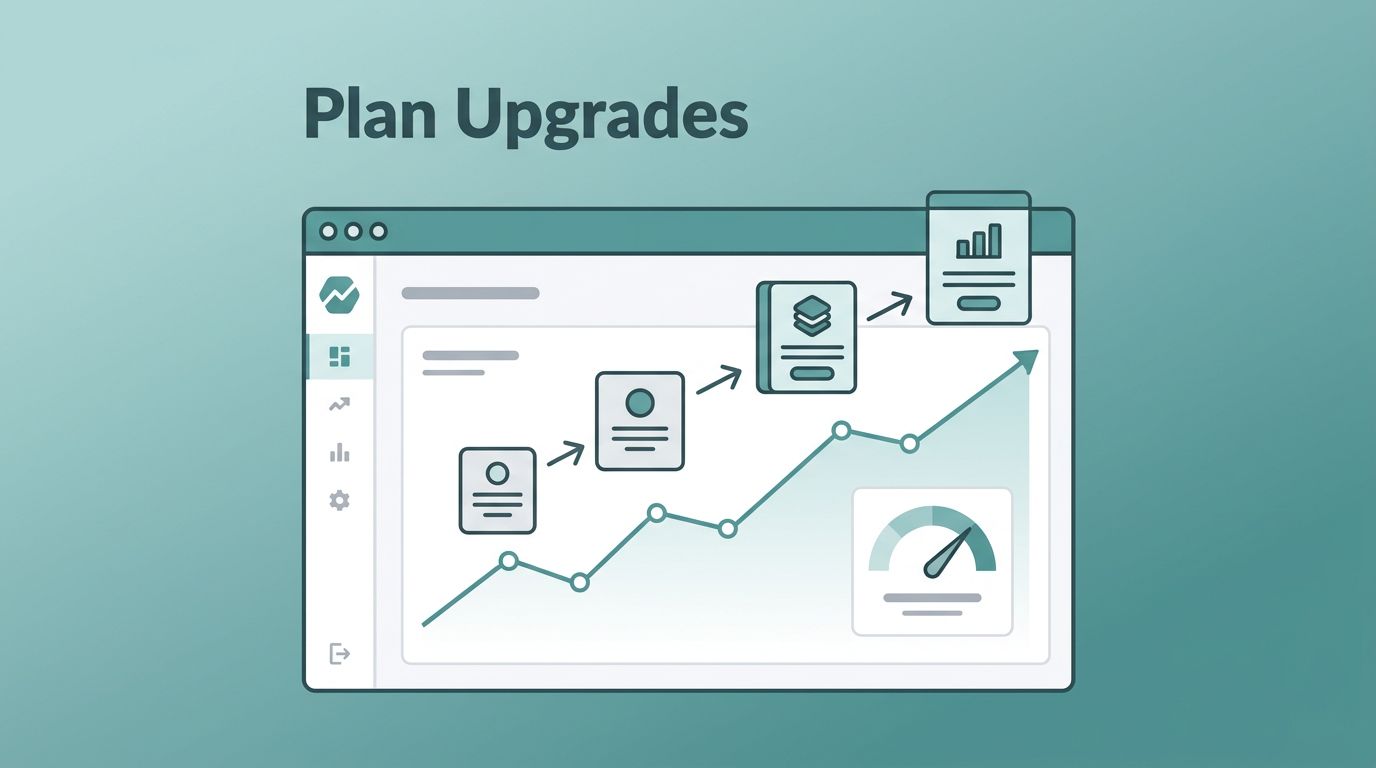
Plan upgrades can look like a clean rise in revenue, then vanish into a crowded chart. I don’t read them that casually. When I watch Baremetrics plan upgrades, I want to know whether the move came from real expansion, a billing change, or a coupon that ran out. That difference matters for MRR, expansion revenue,
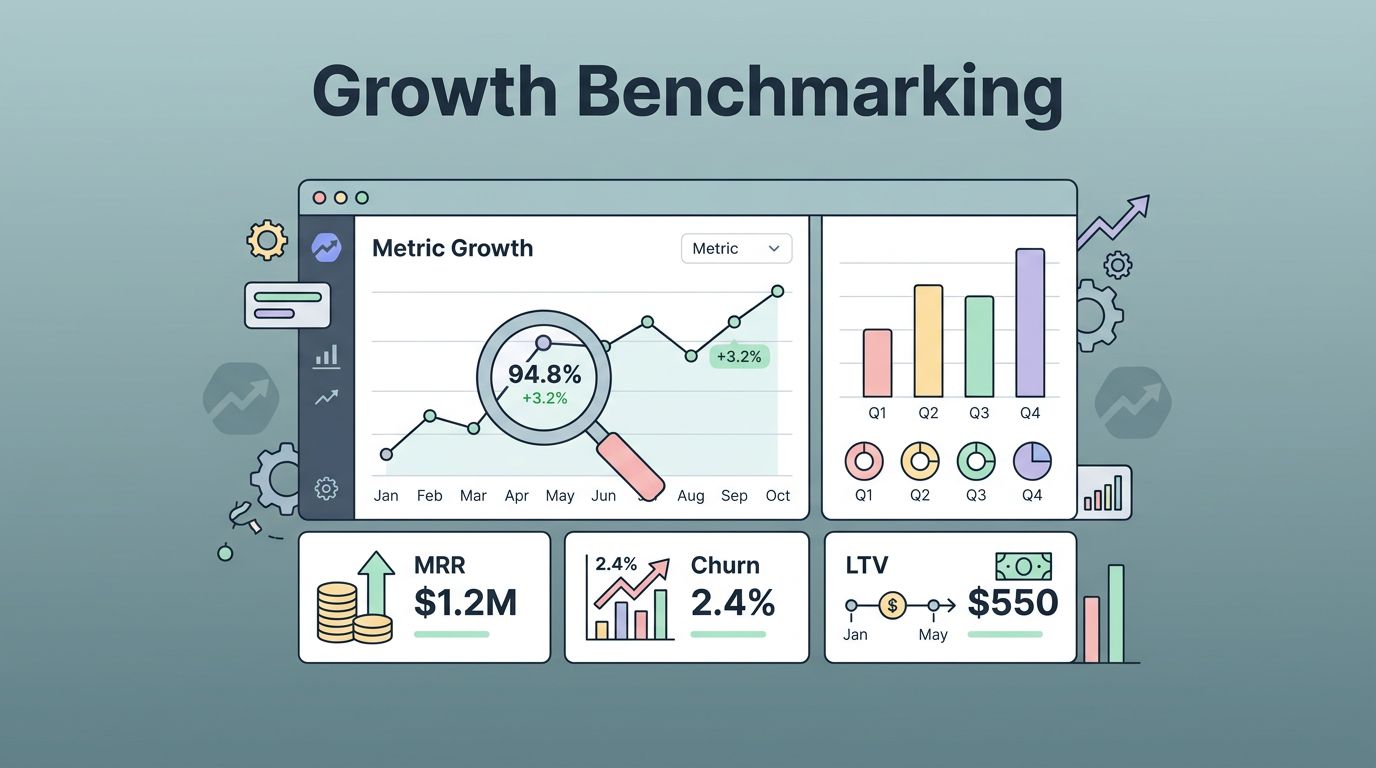
A SaaS business can look healthy and still leak revenue in plain sight. I use Baremetrics to compare MRR, churn, LTV, and failed payments against similar companies, so I can see where my numbers are normal and where they are drifting. Once I have that reference line, I can stop guessing about pricing, retention, and

If I sell in more than one currency, my SaaS metrics can lie to me before lunch. A clean MRR chart can rise because customers upgraded, or because the euro moved. The difference matters when I need to explain performance to finance, investors, or my own team. Baremetrics gives me a way to keep those
