

Revenue can rise while the product quietly loses pull. I pay attention to that gap because it tells me whether customers are buying once or building a habit. When I track Baremetrics active users beside MRR, I get a cleaner read on retention, expansion, and product adoption. A chart that mixes both signals feels less

If my LTV to CAC ratio slips, I can see the problem before revenue tells the story in plain English. Baremetrics helps because it puts the core numbers in one place, but I still need to read them with care. A clean dashboard can still hide a messy formula, and a polished ratio can hide

ChartMogul looks simple until I price it for a real team. The free tier is generous for small SaaS companies, but seat fees and MRR bands can change the bill fast. I checked the published plan details for 2026, and the headline numbers are easy to miss if you only skim the page. If I
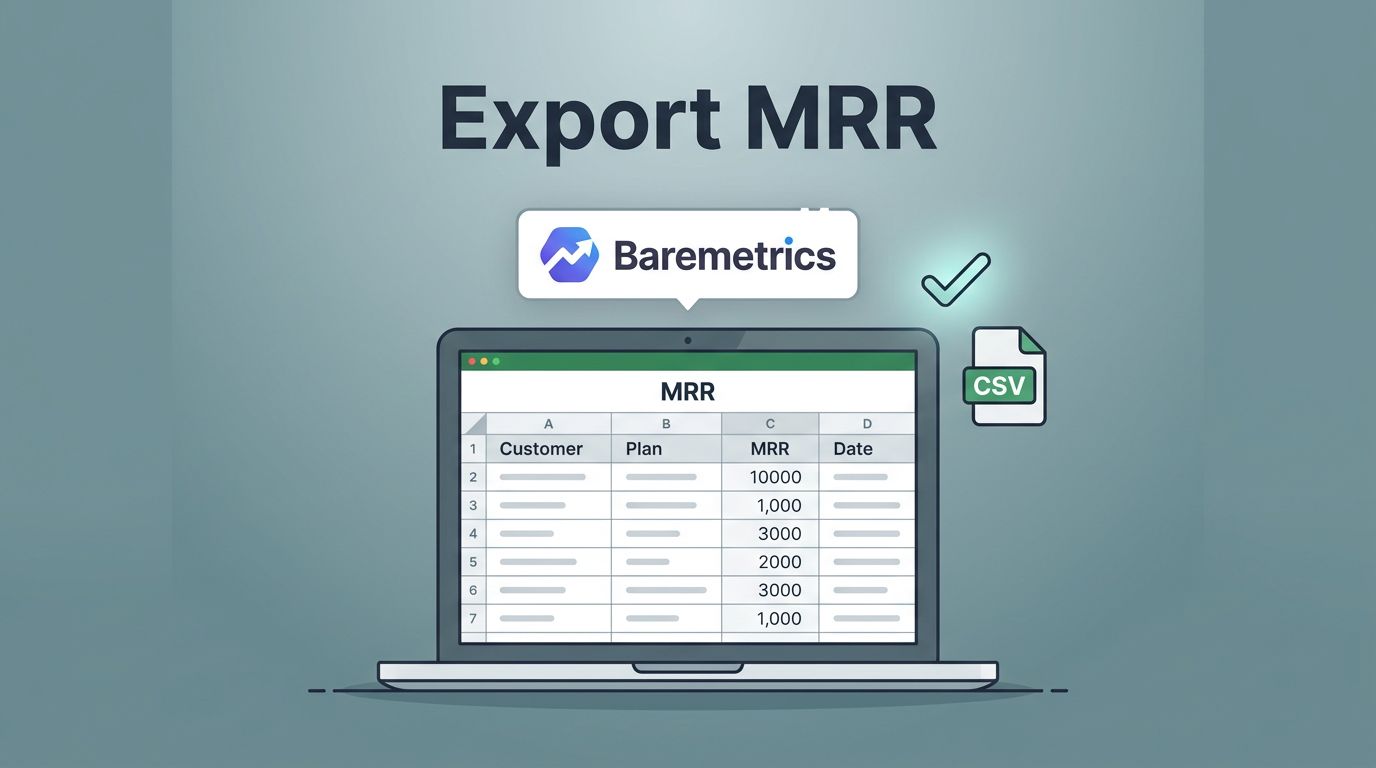
A clean MRR export saves time, but a bad one can send a finance review off the rails. I’ve seen a single wrong filter turn a simple monthly update into a round of confused follow-up questions. Baremetrics makes the export path fairly direct, yet the details matter. I have to pick the right report, set

Cash can disappear faster than a board update can explain it. That is why I use a SaaS runway calculator before I make hiring calls, set fundraising timing, or approve another round of spend. Baremetrics helps because it gives me a clean view of subscription revenue, churn, and MRR. With those numbers in one place,
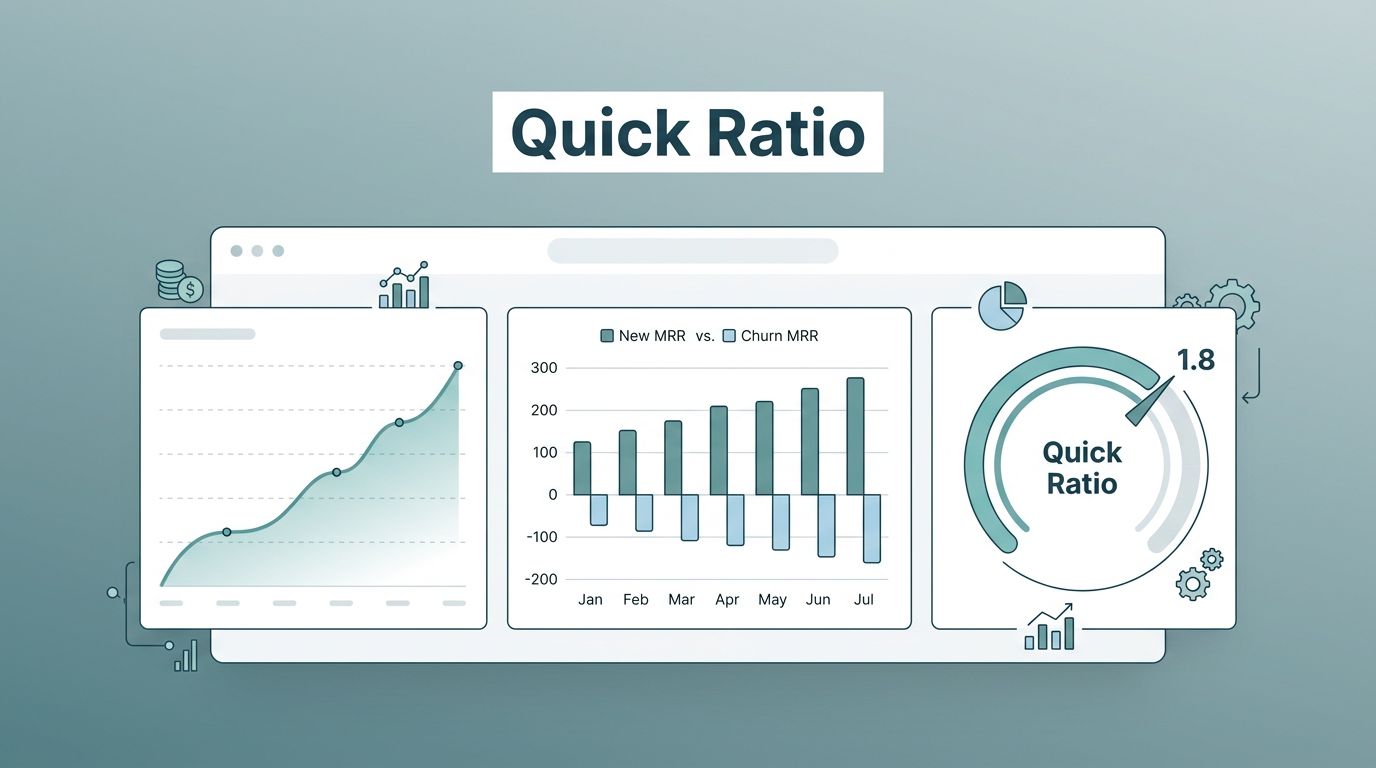
I watch the saas quick ratio when I want a clean read on revenue quality. It tells me whether new and expanded revenue are filling the bucket faster than churn and contraction are draining it. In Baremetrics, I do not treat the number as magic. I treat it as a ratio built from MRR movement,
Churn rarely starts with a dramatic cancellation email. More often, I see it in small cracks: softer MRR, more failed payments, quiet downgrades, and customers who stop growing before they leave. That is why I treat Baremetrics churn risks as a weekly watchlist, not a monthly surprise. When I catch the early signals, I can

Stripe gives me the money trail, but it doesn’t always give me the story behind it. When I’m trying to explain why revenue moved, I don’t want to hunt through exports or stitch together half a dozen reports. That’s why I treat Stripe billing analytics as a decision tool, not a monthly report. Baremetrics helps
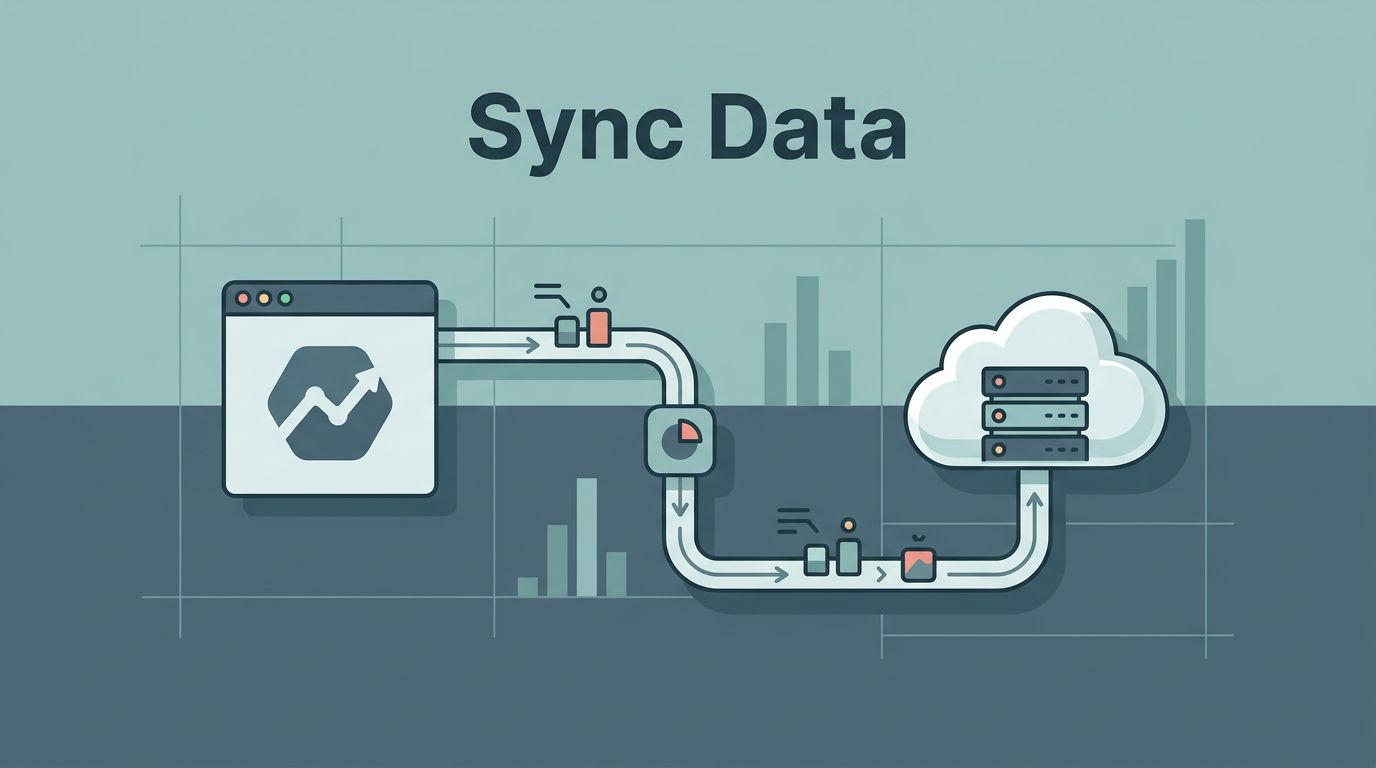
When I build a Baremetrics data warehouse pipeline, I care less about moving rows and more about keeping revenue math honest. Finance wants MRR they can trust, data teams want clean IDs, and operators want numbers they can explain in a meeting. If those pieces do not line up, the warehouse turns into a noisy
